Download
1 / 31
310 likes | 407 Views
Explore the regional variations of multi-decadal climate variability in the Arctic by analyzing surface air temperature, sea level pressure, and sea ice extent data. Investigate the impacts of natural climate mechanisms on different Arctic sectors. Gain insights to differentiate between natural variability and anthropogenic trends.

E N D
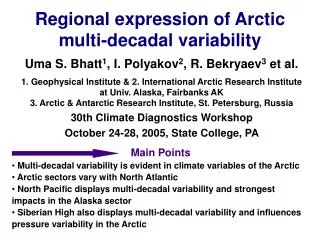
Regional expression of Arctic multi-decadal variability Uma S. Bhatt1, I. Polyakov2, R. Bekryaev3 et al. 1. Geophysical Institute & 2. International Arctic Research Institute at Univ. Alaska, Fairbanks AK3. Arctic & Antarctic Research Institute, St. Petersburg, Russia 30th Climate Diagnostics Workshop October 24-28, 2005, State College, PA • Main Points • Multi-decadal variability is evident in climate variables of the Arctic • Arctic sectors vary with North Atlantic • North Pacific displays multi-decadal variability and strongest impacts in the Alaska sector • Siberian High also displays multi-decadal variability and influences pressure variability in the Arctic
Must understand natural climate variability mechanisms in order to distinguish from trends due to anthropogenic forcing Motivation 10cm total 100 cm rise sea level [ACIA Report, 2004]
Outline Document Observed Arctic Multi-decadal Variability Regional Examination of Multi-decadal Variability in Arctic
Data Information • Monthly Station Data • Surface Air Temperature • Sea Level Pressure • Consolidated several databases • Russian drifting stations • International Arctic Buoy Program • Land stations • Russian Arctic fast ice thickness & ice area • Gridded Data
Composite Arctic Multi-decadal SAT & SLP Variability • Composite time series created from stations north of 62N • SLP peaks offset by 15 years from SAT [Polyakov et al., 2002]
Compare with Arctic SAT Trends from Other Studies [Polyakov et al.,2002]
Eastern Arctic Sea Ice Extent Displays Multi-decadal Signal and is Decreasing • August sea ice extent (in 1000 km) in the Kara, Laptev, E. Siberian, and Chukchi, from Russian ship and aircraft observations & since 1990 satellite records. • Ice lags SAT [Polyakov et al., 2003b]
April Ice Edge in Barents: Retreat since 1850 • Multi-century scale variability is prominent in Arctic [Shapiro and Colony, 2002, Polar Record] Ice edge since 1750, Vinje, 2002
Intermediate Atlantic Water Displays Multi-decadal Variability & Long Term Trend Atlantic Water Temperature Atlantic Water Pathway Ice Thickness [Polyakov et al., 2004]
Origins of this Pattern of Variability - N. Atlantic • • Monthly NAO correlated with Arctic station Surface Air Temperatures • • Strongest in North Atlantic Sector • • Mechanisms • thermohaline circ. • solar variability • greenhouse forcing • MLM + ozone/solar [Polyakov et al., 2003b] • How is multi-decadal variability expressed regionally in the Arctic?
Climatically Consistent Regional Divisions • Greenland Sea • Barents Sea • Kara-Laptev • Central Arctic • E. Siberian/Chukchi • Beaufort Sea • Canadian Archipelago • Greenland
SAT Displays Multi-decadal Variability close to N. Atlantic s = 1.05 s = 1.1 s = 0.58 s = 1.15 • Red line is Smoothed time series • Surface Air Temperature, (Wavelet Analysis) - 1880-1920 Cool; 1920-60 Warm; 1960-80 Cool; 1980-00 Warm.
SAT in Regions that Display Different Variability Hard to tell due to short data set Multi-decadal but a bit different s = 1.30 s = 1.09 s = 0.97 s = 0.83 • More decadal variability in these sectors
SLP Regions That Display Multi-decadal Variability s = 1.59 s = 1.79 s = 1.44 s = 1.76 Sea Level Pressure (Wavelet Analysis) - 1880-1900 High ; 1900-35 Low ; 1935-75 High; 1975-00 Low
Regions not displaying Multi-decadal Variability s = 2.26 s = 1.13 s = 1.15 s = 1.12 • Sea Level Pressure: Regions 5-7, 1950-80 High SLP
Large amplitude multi-decadal oscillations impacts calculation of trends SAT - all regions are warming (orange) except Region 3 Greenland Sea E.Siberian/Chukchi Barents Beaufort SLP -decreasing (green) in regions 1,2,5,6,7 & increasing in Regions 3 & 8. Kara-Laptev Canada Significance of trends decreases as the record gets shorter. Central Arctic Greenland
Large amplitude multi-decadal oscillations impacts calculation of trends Greenland Sea E.Siberian/Chukchi SAT - all regions are warming (orange) except Region 3 Barents Beaufort SLP -decreasing (green) in regions 1,2,5,6,7 & increasing in Regions 3 & 8. Kara-Laptev Canada Significance of trends decreases as the record gets shorter. Central Arctic Greenland
Spatial Variability in Arctic Surface Temperature Trends last 20 years: Cooling over Kara Sea? • Trend all months • Surface Temperature is decreasing over Taimyr Peninsula, between Kara Sea and Laptev Sea. ( Comiso, 2003)
Pacific Decadal Oscillation & Arctic + phase - phase • PDO is the leading PC of monthly SST anomalies in the North Pacific Ocean. • S. Minobe showed 15-to-25 & 50-to-70 years.
Annual Average SAT-Index Correlations NAO is SLP index, positive==> Icelandic low is deeper Black - 99.9% 5-E.Siberia/Chukchi Green - 95.0% 6-E.Alaska/Beaufort PDO (0.41) 3-Kara/Laptev NAO (0.28) NAO (0.49) NAO (-0.68) 7-Canadian Arch. 4 -Central Arctic NAO (0.44) PDO, positive==> Stronger Aleutian low and more warm southerly winds. 2-Barents NAO (0.34) NAO (-0.39) 8-Greenland DJF similar 1-GIN
Siberian High [Gong & Ho, 2002] • October-March feature, Shallow high over Asia, 40-60N & 70-120E • Highs move out of this region into the Arctic • Trend in High since 1980, not as strong…
Recent Changes in Siberian High hPa • Siberian High has trend and displays some low frequency variability • What is this variability associated with? Multi-decadal fluctuations in Indian Ocean…
Siberian High, Arctic SLP, & NAO • Recent low pressure seen in Arctic SLP follows Siberian High Anomalies
SLP differences between warm and cold decades in the Arctic • What may be happening? • Highs (from Siberian High) entering Arctic are weaker acting to maintain a lower SLP • NCEP reanalysis shows about half the anomaly
Annual Average SLP-Index Correlations NAO negative correlations, positive phase means lower pressures Black - 99.0% 5-E.Siberia/Chukchi NAO (-0.25) Blue - 95.0% 6-E.Alaska/Beaufort SHi (0.24) NAO (-0.23) SHi (0.35) 3-Kara/Laptev NAO (-0.28) 7-Canadian Arch. 4 -Central Arctic NAO (-.31) SHi (0.37) 2-Barents Siberian High - positive correlations, strong high ==> higher SLP NAO (-.71) NAO (-0.64) SHi (0.23) PDO negative correlations DJF in R 5 & 6 8-Greenland 1-GIN
Summary • Multi-decadal variability is more prevalent in North Atlantic sector of Arctic • North Pacific displays multi-decadal variability that influences impacts the Alaska sector • Siberian High also displays low frequency variability and influences pressure variability in the Arctic • Records are short (two realizations) so we need to find analogs in GCMs to study the mechanisms (working on this)
Acknowledgements Frontier Research System for Global Change Geophysical Institute (GI) International Arctic Research Center (IARC) Others on Multi-decadal Variability Team G. Alexeev, R. Colony, M. Johnson, H. Simmons, L. Timokov, D.Walsh, & J. Walsh
Correlations between Indices • DJF • NAO => SiHi -0.28 (95%) • SOI => SiHi 0.26 (95%) • AO => SiHi -0.50 (99%) • NAO => SiHi : Changing Correlation over time… • 1920-59: -0.05 • 1960-00: -0.29
-20 +20 NAO Relationship to SAT & Ice Observed Sea Level Pressure pattern associated with ice anomalies (Red-less ice and Blue-more ice) More southerly (northerly) advection less (more) ice Deser et al. 2000
DJF SAT-Index Correlations Similar to Annual Black - 99.9% 5-E.Siberia/Chukchi 6-E.Alaska/Beaufort PDO (0.32) 3-Kara/Laptev NAO (0.38) NAO (0.66) NAO (-0.4) 7-Canadian Arch. 4 -Central Arctic NAO (0.48) 2-Barents NAO (0.45) NAO (-0.55) 8-Greenland 1-GIN