Download

1 / 15
150 likes | 155 Views
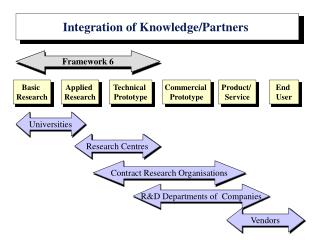
Explore the daily traffic patterns, top applications, and household penetration in the Acreo National Broadband Test Bed using real-time monitoring and deep packet inspection. Discover the dominance of peer-to-peer traffic and the asymmetric nature of outbound traffic.

E N D
Traffic Measurements and End User Behavior in the Acreo National Broadband Test Bed Andreas Aurelius, Adnan Mahmood, Anders Berntson, Gunnar Arvidsson, Kåre Gustafsson
The Acreo test bed • 250 test pilots • FTTH, xDSL, PON
Measurement tool • Packetlogic from Netintact • Real time monitoring • Deep packet/Deep flow inspection1 => Application based detection 1 www.netintact.com
Measurement focus • Daily pattern • Top applications • Top households • Penetration of applications • Difference between peak hour traffic mix and overall traffic mix
Measurement limitations • 173 households • 75 days • Applications over public Internet (i.e.no IPTV, no IPtelephony)
Hourly traffic load, averaged over 75 days PEAK HOURS
Penetration – top 10 applications Percentage of households using each application
Penetration - categories Percentage of households using each category
Application categories for top 10 % households Percentage of total traffic per category
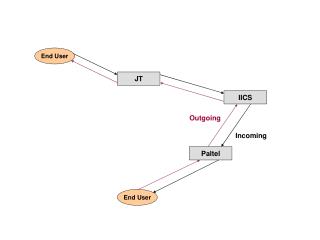
Conclusions • > 90 % peer-to-peer, dominating the traffic pattern • High penetration of peer-to-peer (>80%), A/V streaming (>95%), VoIP (60%), http (100%) • Asymmetric traffic (Outbound dominating, coming from peer-to-peer applications) • 10 % of the households use 67 % of the traffic • No big difference between peak hour and overall traffic mix • < 3 % unknown
Further work • Trends • Comparison with other networks • Deeper statistical analysis • Traffic models Celtic project TRAMMS – Traffic Measurements and Models in Multi-Service Networks • TRAMMS scope: • Traffic measurements in different parts of Europe • Broadband bottleneck analysis • Traffic models based on the results • Capacity planning based on the models • 14 partners, 5 countries, 50 person years over 3 years • Planned start Q1 2007