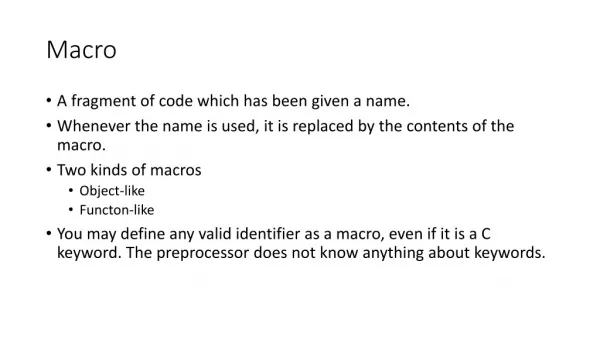
Macro integration
Learn about Macro Integration and how it reconciles inconsistent statistical data on a high level of aggregation. See how balancing is achieved for comprehensive economic statistics like National Accounts in the Netherlands.


Macro integration
E N D
Presentation Transcript
Presented by Piet Verbiest Statistics Netherlands
Macro integration Reconciliation of inconsistent statistical data on a high level of aggregation Balancing is reconciling inconsistent statistical information from independent sources brought together in an ‘accounting’ framework consisting of well-defined variables, accounting identities on combinations of variables and other less strict relations between the sets of variables.
Macro integration National accounts an example
National accounts • Comprehensive overview of alleconomic transactions in a country • Quarterlyandannual report of a country Key indicators • Gross domestic product (GDP): economicgrowth; • Gross nationalincome • Consumption of households, investment, foreigntrade • Governmentdebt • Employment
National accounts in the Netherlands Supply andusetables Labour accounts Sector accounts
Supply and use tablesVariables and basic identities identities (1) P + M = IC + C + I + E (2) Y = P - IC (3) Y = C + I + E - M (4) Y = W + OS/MI
Macro integration / balancing 355 5 475 355
Macro integration / balancing 225 20 225 495
Macro integration / balancing 275 295 20 50 295 275 465
SUPPLY USE Output of Input of Cons Total Export Import Invest. industries Total industries Commodities P M IC+Y C E I Y Total Value added P + IC Y = GDP =
USE SUPPLY Cons. Output of Input of Invest. Export Import industries Total total industries Commodities Y Total P M IC+Y E C I P - IC = Y = GDP P–IC = Y =C+I+E-M P + M = IC + C + E + I
Commodities: 500 • Industries: 150 • Finalexpenditure: 20 • Simultaneous: cup andcop
Presented by • Jacco Daalmans • j.daalmans@cbs.nl
Mathematical Models 5=7 Mathematical models 3+7=10 2+9=10 6=6 1=0 22=17+5 22=17 15/2=7 12+3+10=25
Mathematical models • Can be automated • Reproducible results • Flexible • Large scale applications
Example 1: Whisky Imports = Consumption Given: Imports = 5, Consumption=0 Model outcomecouldbe: Imports= 2.5 Consumption = 2.5 NOT DESIRABLE!
Example 2: Remainingdiscrepancies Production (P) = 930 Imports (M) = 275 Interm. Cons. (IC)= 450 Cons. Invest. Export (CIE)= 740 P+ M = IC + CIE 1205 ≠ 1190 P – IC = CIE – M 480 ≠ 465
Example 2: Remainingdiscrepancies Production (P) = 930 928 Imports (M) = 275 272 Interm. Cons. (IC)= 450 455 Cons. Invest. Export (CIE)= 740 745 P+ M = IC + CIE 1205 ≠ 1190 1200=1200 P – IC = CIE – M 480 ≠ 465 473=473
Different models • RAS/IPF/RAKING - easy, numericaltechnique - for a specificproblem • STONE - broad scope of applicability - mathematicaloptimization • DENTON (benchmarking) - Time component (quarterlyandannual data)
STONE’s Method • Broadapplicability • Achievesconsistencybysolving a minimum adjustmentproblem
STONE’s Method Searchesfor a resultwith minimum deviationfrom the input. Mathematical: Translationto a least squares optimizationproblem Consistencyrules translate toconstraints of the model.
STONE’s Method Linearconstraints, like: • Total is the sum of components: Manufacturing = Food + Textiles + Clothing; • Commodity balances; Total use = Total supply; • Definitions: Value added = Output – Intermediate consumption
Extensions Inequalityconstraints: Total Use ≥ 0 Soft constraints: Stocks of perishablesgoods ≈ 0 Ratio constraints: Value added Tax / Supply = 0.21 Refineries: use of crudeoil / output ≈ 0.7
A man with a watch knowswhat time it is A man withtwowatches is never sure (Segal’sLaw)
Reliabilityweights Important instrument tosteer the results.
Example 2: Remainingdiscrepancies Production (P) = 930 928 Imports (M) = 275 272 Interm. Cons. (IC)= 450 455 Cons. Invest. Export (CIE)= 740 745 P+ M = IC + CIE 1200=1200 P – IC = CIE – M 473=473
Example 2: Remainingdiscrepancies Production (P) = 930 928 930 Imports (M) = 275 272 270 Interm. Cons. (IC)= 450 455 450 Cons. Invest. Export (CIE)= 740 745 750 P+ M = IC + CIE 1200=1200 1200=1200 P – IC = CIE – M 473=473 480= 480 green = p and IC more reliable
Conclusions Mathematical methodspowerful instrument Elaboratemodellingconstructionspossible But shouldbeusedproperly!