Good Graph
How to create Good Graphs and Charts

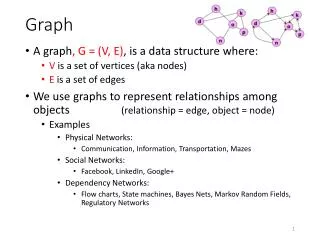
Good Graph
E N D
Presentation Transcript
A picture is worth thousand words 4 Stages of Life
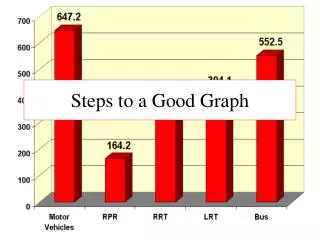
Chart or a Graph • Remember, give a Graph / Chart only if • You want avoid thousand words • Clarify not confuse • Influence the viewer • Convey abigger picture • Less is more with graphs
How to create a good graph • Ascertain the purposeof the chart. • Identifythe variables and their relationships. • Zero in on to the chart type that best suits to visualize the data to show the big picture • Check – does it show a big picture ? • Think from the audience viewpoint Hence the need is to know what is a good chart and understand types of charts to present data
Components - X axis • Y Axis – Customary to use dependent variables. • Must be labeled to show range • Title of Y Axis must be clear
Components – Y axis • X axis – Customary to use independent variables like time, months, qtrs, years etc. • Must be labeled to show range • Title of X axis must provided if the variables on the x axis are not very obvious
Components - Title A meaningful title that explains what the graph is all about
Components – data labels Data labels are values for easy understanding of data
Components - Legend Legend is the key to the data plotted
Good vs. Bad Graphs • Good graphs will: • Give a clear visual display of the point you are trying to make • Bad graphs will: • Confuse the reader • Does not make any sense • Misinterpret data Visually
Types of Simple Graphs • Line Charts • Area Charts • Column Charts • Bar Charts • Segmented Bar / Column Charts • 100% Segmented Bar/Column Charts • Pie Charts • Doughnut Charts