Compute Trendline Values In Excel
200 likes | 760 Views
Compute Trendline Values In Excel with formulae

Compute Trendline Values In Excel
E N D
Presentation Transcript
Trendline values in excel charts Computing trend line values using excel formulas and functions Warning: This is for those who wish to explore trend lines in excel. For others, this presentation may be intimidating . Kindly exercise caution!
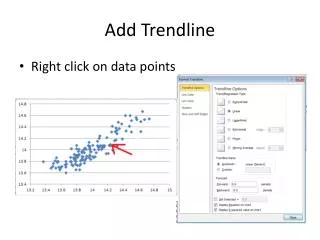
Trendlines in charts • A trend line is a straight line connecting multiple points on a chart. • A trend is a movement in a particular direction • The magnitude of the slope of a trend line, or steepness, indicates the strength of the trend. • Trend lines can be used to forecast future !
Six types of trend lines • Linear • Logarithmic • Polynomial • Power • Exponential • Moving Average How to Create a Trendline? – Have a look at my earlier post in LCDing Slide share presentation
Rule of thumb : Use type of Trend line • 1. Linear trend line : use it if data values are increasing or decreasing at a steady rate. • 2. Logarithmic trend line : Useful when the rate of change in the data increases or decreases quickly and then levels out. • 3. Polynomial trend line : Used when there are data fluctuations like the sales following seasonal trends
Rule of thumb : use type of Trend line • 4. Power trend line : Use with data that has values that increase at specific rate at regular intervals. • 5. Exponential trend line : Use when data values increase or decrease rates that are constantly increasing. • 6. Moving average trend line : Use it when uneven fluctuations are in data values
Trend line values using excel formulae You can use the formulas given in the next few slides. Alternatively, you can download and use the excel attached with all formulas. To download excel file, click here
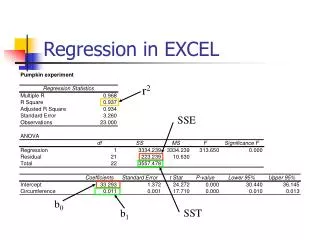
Linear Trendline equation • Equation: y = m * x + bWhere, m =SLOPE(y,x) b =INTERCEPT(y,x) • RSQ =RSQ(y,x)
Logarithmic Trendline equation • Equation: y = (c * LN(x)) + b Where, c =INDEX(LINEST(y,LN(x)),1) b =INDEX(LINEST(y,LN(x)),1,2) • RSQ =RSQ(y,LN(x))
Power Trendline Equation • Equation: y=c*x^b Where, c =EXP(INDEX(LINEST(LN(y),LN(x),,),1,2)) b =INDEX(LINEST(LN(y),LN(x),,),1) • RSQ =INDEX(LINEST(LN(y),LN(x),TRUE,TRUE),3,1)
Exponential Trendline equation • Equation: y = c *e ^(b * x) Where, c =EXP(INDEX(LINEST(LN(y),x),1,2)) b =INDEX(LINEST(LN(y),x),1) • RSQ =RSQ(LN(y),x)
Polynomial Trendline(2nd order) Equation • Equation: y = (c2 * x ^2) + (c1 * x^1) + b Where,c2 =INDEX(LINEST(y,x^{1,2}),1) c1: =INDEX(LINEST(y,x^{1,2}),1,2) b = INDEX(LINEST(y,x^{1,2}),1,3) • RSQ =INDEX(LINEST(y,x^{1,2},TRUE,TRUE),3,1)
Polynomial Trendline(3rd order) Equation • Equation: y=(c3*x^3) + (c2*x^2) + (c1*x^1) +b Where, c3 =INDEX(LINEST(y,x^{1,2,3},1) c2 =INDEX(LINEST(y,x^{1,2}),1) c1 =INDEX(LINEST(y,x^{1,2}),1,2) b = INDEX(LINEST(y,x^{1,2}),1,3) • RSQ =INDEX(LINEST(y,x^{1,2,3},TRUE,TRUE),3,1)
Polynomial Trendline(4th order) Equation • Equation: y= (c4*x^4)+(c3*x^3) + (c2*x^2) + (c1*x^1) +b Where, c4 = INDEX(LINEST(y,x^{1,2,3,4},1) c3 =INDEX(LINEST(y,x^{1,2,3},1) c2 =INDEX(LINEST(y,x^{1,2}),1) c1 =INDEX(LINEST(y,x^{1,2}),1,2) b = INDEX(LINEST(y,x^{1,2}),1,3) • RSQ =INDEX(LINEST(y,x^{1,2,3,4},TRUE,TRUE),3,1)
Polynomial Trendline(5th order) Equation • Equation: • y= (c5*x^5)+(c4*x^4)+(c3*x^3) + (c2*x^2) + (c1*x^1) +b Where, c5 = INDEX(LINEST(y,x^{1,2,3,4,5},1) c4 = INDEX(LINEST(y,x^{1,2,3,4},1) c3 =INDEX(LINEST(y,x^{1,2,3},1) c2 =INDEX(LINEST(y,x^{1,2}),1) c1 =INDEX(LINEST(y,x^{1,2}),1,2) b = INDEX(LINEST(y,x^{1,2}),1,3) • RSQ =INDEX(LINEST(y,x^{1,2,3,4,5},TRUE,TRUE),3,1)
Polynomial Trendline(6th order) Equation • Equation: y=(c6*x^6)+(c5*x^5)+(c4*x^4)+(c3*x^3) + (c2*x^2) + (c1*x^1)+b Where, c6 = INDEX(LINEST(y,x^{1,2,3,4,5,6},1) c5 = INDEX(LINEST(y,x^{1,2,3,4,5},1) c4 = INDEX(LINEST(y,x^{1,2,3,4},1) c3 =INDEX(LINEST(y,x^{1,2,3},1) c2 =INDEX(LINEST(y,x^{1,2}),1) c1 =INDEX(LINEST(y,x^{1,2}),1,2) b = INDEX(LINEST(y,x^{1,2}),1,3) • RSQ =INDEX(LINEST(y,x^{1,2,3,4,5,6},TRUE,TRUE),3,1)
Few Basics – Excel functions used - 1 • X= Known X's (e.g.: Months on X Axis) • Y= Known Y's (e.g.: Sales on Y Axis) • Details of Excel functions are taken from Excel Help LN • LN(number) • Returns the natural logarithm of a number. Natural logarithms are based on the constant e (2.71828182845904). • Liniest • LINEST(known_y's,known_x's,const,stats) • Calculates the statistics for a line by using the "least squares" method to calculate a straight line that best fits your data, and returns an array that describes the line. Because this function returns an array of values, it must be entered as an array formula. • Exp • EXP(number) • Returns e raised to the power of number. The constant e equals 2.71828182845904, the base of the natural logarithm. • Index • INDEX(array,row_num,column_num) • INDEX(reference,row_num,column_num,area_num) • Returns a value or the reference to a value from within a table or range. There are two forms of the INDEX() function: array and reference. The array form always returns a value or an array of values; the reference form always returns a reference.
Few Basics – Excel functions used - 2 • RSQ • RSQ(known_y's,known_x's) • Returns the square of the Pearson product moment correlation coefficient through data points in known_y's and known_x's. For more information, see PEARSON. The r-squared value can be interpreted as the proportion of the variance in y attributable to the variance in x. • Slope • SLOPE(known_y's,known_x's) • Returns the slope of the linear regression line through data points in known_y's and known_x's. The slope is the vertical distance divided by the horizontal distance between any two points on the line, which is the rate of change along the regression line. • Intercept • INTERCEPT(known_y's,known_x's) • Calculates the point at which a line will intersect the y-axis by using existing x-values and y-values. • Logest • LOGEST(known_y's,known_x's,const,stats) • In regression analysis, calculates an exponential curve that fits your data and returns an array of values that describes the curve. Because this function returns an array of values, it must be entered as an array formula.
Incase you need more details… • I have learned these formulas form the following web sites and authors. • Click the links below • Trendline formulas • Bernard Liengme’s website • Tushar Mehta’s article • Ozgrid Forum • Trends-and-forecast-sales-with-charts • Choosing-the-best-trendline-for-your-data