Download

1 / 12
130 likes | 305 Views
Model using Trendline Linear 3Factor in Excel 2013. by Milo Schield Member: International Statistical Institute US Rep: International Statistical Literacy Project Director, W. M. Keck Statistical Literacy Project Slides at: www.StatLit.org/pdf

E N D
Model using Trendline Linear 3Factor in Excel 2013 by Milo Schield Member: International Statistical Institute US Rep: International Statistical Literacy Project Director, W. M. Keck Statistical Literacy Project Slides at: www.StatLit.org/pdf /Model-Trendline-Linear-3Factor-Excel2013-6up.pdf
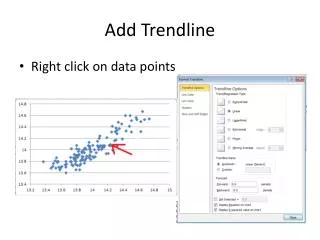
Goal: Summarize association before/after control for Gender Generate six XY charts as shown. No writing. Show linear trendline, regression and R2 as shown. Use XL1 (Pulse.xls) data set. Subjects are college students. Pulse1 is their resting pulse. For details on using Excel Chart Trendline to build a model, see www.StatLit.org/pdf/Model-Trendline-Linear-Excel2013-6up.pdf 2
#1 . 3
#2 . 4
#3 . 5
#4 . 6
Need separate series for Men and for Women 7 Step 1. Copy data to a new sheet. Sort entire dataset by MALE Step 2. Copy sorted data from A:H to J:Q.Change headings to distinguish M vs. F. Step 3. Delete guys from gals series (Male=0);delete gals from guys series (Male=1). Step 4. Use separated cols for graphs 5 and 6.
Move data into separate series (separate columns) by Gender 8 Women:Min(Weight-F) = 95#Max(Weight-F) = 150# Min(Weight-M) = 123#Max(Weight-M) = 215#Men:
#5 . 9
#6 . 10
Results in words #1 As height increases by 1 inch, weight increases by 5.1 pounds (R-squared = 62%) rest pulse decreases by 0.64 bpm (R-squared = 5%) #3W For women, as height increases by 1 inch, weight increases by 2.6 pounds (R-squared = 24%) rest pulse decreases by 0.48 bpm (R-squared = 1%) #3M For men, as height increases by 1 inch, weight increases by 4.4 pounds (R-squared = 36%) rest pulse INCREASES by 0.21 bpm (R2 = 0.3%) 11
Conclusion Difference in gender explains part of the association between height and related variables such as weight and resting pulse. Failure to take into account gender can result in: associations that are spurious. associations that reverse associations that increase or decrease. Moral: What you take into account matters! 12