Download
1 / 21
250 likes | 515 Views
Stream Project. Alyssa, Ian, Nick, Dan, Kosuke, and Billy. A. TDS and TSS. TDS – Total Dissolved Solids Conductivity More dissolved solids in the water, more conductivity TSS – Total Suspended Solids How much sediment is carried by a stream. K. Conductivity. K. TSS. Paper: 0.5 g.

E N D
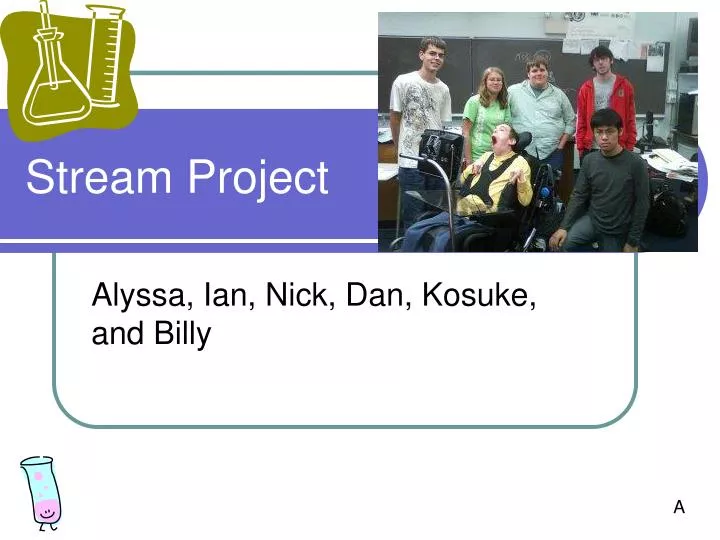
Stream Project Alyssa, Ian, Nick, Dan, Kosuke, and Billy A
TDS and TSS • TDS – Total Dissolved Solids • Conductivity • More dissolved solids in the water, more conductivity • TSS – Total Suspended Solids • How much sediment is carried by a stream K
TSS Paper: 0.5 g Water: 150 ml K
Not much rain in the last week or two • Little sediment got into the stream No erosion • No phosphates nor nitrates • If there were more rain, there might be more TDS or TSS. K
Testing Oxygen • When testing the oxygen levels you need to gather up 25 milliliters from the three sections of the stream. The pool, the riffle, and the run. Then after collecting each water sample in a beaker and then we took the ampule (which is filled with a chemical that reacts to the oxygen in the water) after breaking off the tip of the ampule and watched it to see if it changed color. After waiting several seconds the color is matched up on a chart and then recorded on the work sheet. I
Testing Phosphates • When testing the Phosphate levels in the stream several things must be done. First gather up 25 milliliters of water from each are of the stream; the run, riffle, and the pool. After collected each sample in a beaker add two drops of phosphate into the water. Swirl it slightly to mix it in. Then taking the ampule break off the tip in the water and watch to see if the chemical in the ampule changes color. After waiting several seconds compare the color of the ampule to the chart and then record the results on the paper. I
Testing Nitrate/PH • Using a small tab to test the Nitrate and PH levels in the Run, Riffle, and Pool. First you go to each area of the stream and then using two tabs for each area. Dunk the tabs slightly into the water and then wait about two seconds. After doing each tab for each area of the stream use the Nitrate and PH chart to see what the levels are for each area of the stream. Then using that information you record the results on your paper. I
Testing Dissolved Oxygen • After getting the first half of the information from the Testing Oxygen lab you then test the rate of that the oxygen dissolves. Take all of your water samples from each area of the stream and then you use to the Dissolved Oxygen Meter. You take the meter and dunk the end of it in the water sample. You then stir it slightly till you get to the highest oxygen level. Then looking at the computer screen you watch to see how fast the oxygen level falls for each sample then your record your results on the paper. You repeat this process for all areas of the stream. I
Graph of Dissolved Oxygen • Dissolved O2 Riffle Chemical Meter 9 1.1 9 1.1 Run Chemical Meter 10 .9 7 .9 Pool Chemical Meter 11 .8 7 .8 I
Graph of Phosphates • Riffle 0 0 Run 0 0 Pool 0 0 I
Graph of Nitrates and Ph Nitrate Ph Riffle Run Pool Riffle Run Pool 0 1.1 0 5 5.5 6 0 0 0 7 4 5 I
Leeches Johnny Darter Gilled snails, water pennies, damselfly, mayfly, dragonfly larva, clams Algae Raw Materials D
Critter Catching 101 • Wade into either the Run, Riffle, or Pool. • Have your partner hold the net down into the stream. • Have the person not holding the net begin kicking the stream bed rocks. • Make sure the net holder is catching the sediment in the net. • Take the net out of the water and empty the contents into a tub. D
Run N
Riffle N
Macro invertebrate • The stream health macro invertebrate sheet tells how healthy a stream is by the organisms living in or near it. In the run we found 2 sensitive critters which are good. And 1 somewhat sensitive critter. We found no tolerant critters. The run is an 8 which is poor. The riffle had 2 sensitive critters and 3 somewhat sensitive critters. The riffle also had 1 tolerant critter. The riffle had a score of 13 which is a fair score. The pool had 1 sensitive critter and 1 somewhat sensitive critter and 1 tolerant critter. It had a score of 6 which is poor. The area with the most critters was the riffle. It also had the most “good” critters. A reason for that could be that there is more oxygen in the riffle. The critters can also hide on one side of the rocks and not be taken downstream. On a side note there were 831 algae in the riffle, 996 algae in the run, and 302 algae in the pool. A
HEI • The HEI sheet helps evaluate abiotic or non-living factors in the stream. The HEI sheet told me that the stream is not extra healthy but it is not terribly bad either, it is about medium or average. The pool has a score of 79. the riffle has a score of 69. and the run has a score of 77. the overall score of the stream as a whole is 87. which is pretty good. The plants found along the stream are good because they provide oxygen, shade, and breeding grounds. A
Comparing • Comparing all three sections of the stream; all three have their differences. The pool, seemed to have a greater concentration of fish than the riffle and run, likely because of the greater number of hiding places. The riffle had more macro invertebrates likely because there were more rocks to cling to and more algae to consume. The run did not even have much of anything at all. But a reason for these findings could be that we got preoccupied with catching fish and were one of the last groups to collect animal data. So the stream had already been stirred up. D
Sources • www.scientificillustrator.com • www.aquaticplantcentral.com • Troutnut.com • http://www.cals.ncsu.edu/course/ent525/water/aquatic/pages/15_jpg.htm • http://bugguide.net/node/view/53307 N