Download
1 / 51
510 likes | 530 Views
Explore the significance of survey statistics in the marina industry for business growth, investment insights, and benchmarking. Gain insights on respondent profiles, regional trends, revenue and expense analysis, and net profit evaluation.

E N D
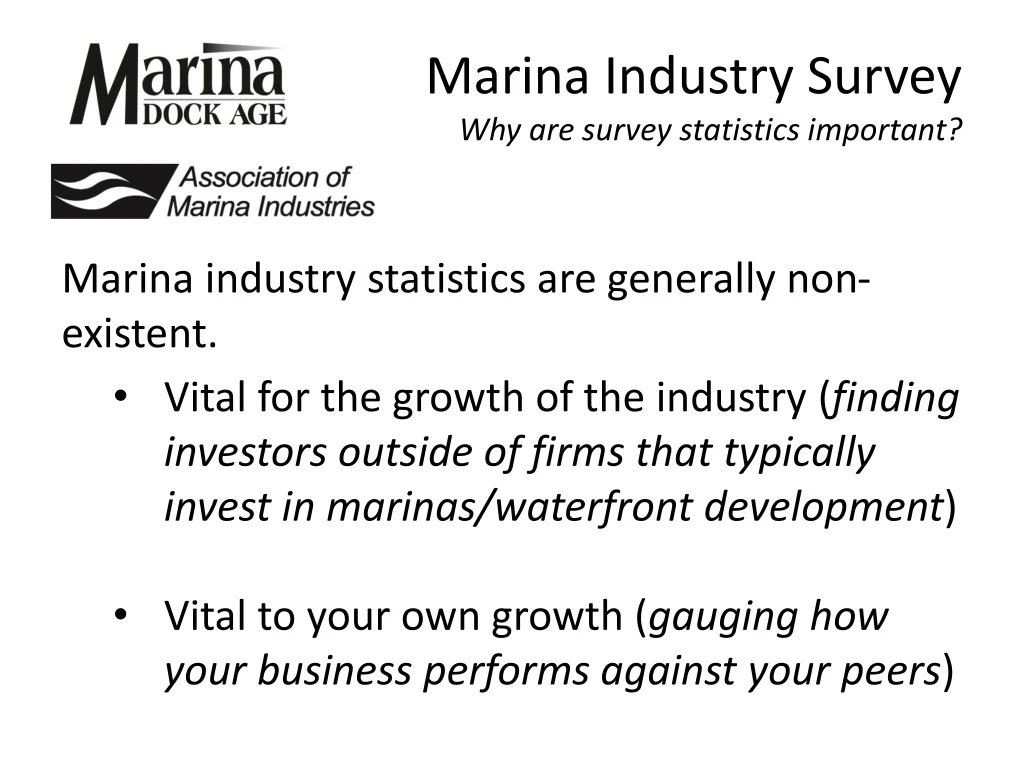
Marina Industry SurveyWhy are survey statistics important? Marina industry statistics are generally non-existent. • Vital for the growth of the industry(finding investors outside of firms that typically invest in marinas/waterfront development) • Vital to your own growth(gauging how your business performs against your peers)
Survey Topics • Respondent profile – does this reflect the general population? • Region • Waterbody • Size/#of Slips • Ownership • Type of facility • Age of the facility • Average boat size • Occupancy and Rates • Products/Services • Revenues and Expenses • Profit National Perspective–gauge the overall health of the industry
Respondent Profile 4% 12% 10% 11% 21% 18% 16% 16% • 34% 46% 2% 4% 7%
Respondent Profile waterbody Great Lakes 11% Ocean- West Coast 16% Inland- West 7% Inland- Central 12% Ocean- East Coast 32% Inland- East 23%
Respondent Profile(STATES) States not represented: Alaska Arizona D.C. Iowa Louisiana Mississippi Montana Nebraska Nevada New Hampshire North Dakota Oregon South Dakota Utah Vermont West Virginia Wyoming Alabama – 1% Arkansas – 0.4% California – 13% Colorado – 1% Connecticut – 2% Delaware – 0.4% Florida – 15% Georgia – 2% Hawaii – 0.4% Idaho – 0.4% Illinois – 1% Indiana – 0.4% Kansas – 0.4% Kentucky – 0.4% Maine – 2% Maryland – 4% Massachusetts – 4% Michigan – 4% Minnesota – 1% Missouri – 3% New Jersey – 3% New Mexico – 0.4% New York – 7% North Carolina – 5% Ohio – 2% Oklahoma – 1% Pennsylvania – 2% Rhode Island – 1% South Carolina – 4% Tennessee – 3% Texas – 5% Virginia – 5% Washington – 3% Wisconsin – 5%
Respondent Profile facility type 52% 48% Slips/Storage only vs. Service
Corporate 6% Respondent Profile ownership Other 6% Gov’t 15% Private 73%
Respondent Profile size/# of slips Large- 33% Small- 30% Medium-32%
Respondent Profile facility age New-3% Mid-39% Old-58%
Respondent Profile average boat size ¼ mid-sized boats Megayacht market small % ¾ majority
Respondent Profile largest boat size
Occupancy Current overall rate % GREAT! 39% at mid-level occupancy 38% at good occupancy
Occupancy Current rate % (Regional)
Occupancy RATE % Facility size/# of slips
Occupancy % RaTE Facility age Large majority 1/3 new are struggling
Occupancy RATE % Ownership
Occupancy RATE % Facility type
Occupancy RATE % Average boat size
2012 Occupancy Compared to 2011 ¼ lower 1/3 not growing Majority higher
Occupancy Overtime (2009-2012)
2012 Rates, compared to 2011 slips/storage/maintenance Large majority unchanging 1/3 increased rates Small %
2012 Rates/by waterbody No Decreases
2012 Rates/by facility size Largest majority w/ increased rates
2012 Rates/by average boat size Largest boats had largest decrease 0%
Products/Services Overall revenues compared to 2011 In-water slips/services and storage Largest increases Service/Maintenance Largest increases Largest increases Largest increases Minority decreases
Products/Services Overall revenues compared to 2011 Boat sales/rental Extras Largest increases Largest increases
Products/Services Revenues BY REGION South Midwest Northeast West
Products/Services Revenues BY SIZE SMALL-less than 100 slips MEDIUM-100 to 250 slips LARGE-more than 250 slips
Overall Expenses compared to 2011 Large majority w/increases
Individual Expenses compared to 2011, part one Very small minority had decreases Majority of expenses were same as 2011
Individual Expenses compared to 2011, part two Very small minority had decreases
Expenses highlights BY REGION WEST Midwest NORTHEAST SOUTH
Expenses highlights BY SIZE SMALL-less than 100 slips MEDIUM-100 to 250 slips LARGE-10more than 250 slips
Expenses highlights BY AVERAGE BOAT SIZE Increase decrease stay same 41 to 60 feet 20 to 40 feet More than 81 ft 61 to 80 feet
Net Profit will you make one? ? Large majority
Net Profit average boat size 0% with no net profit


