Download
1 / 14
140 likes | 299 Views
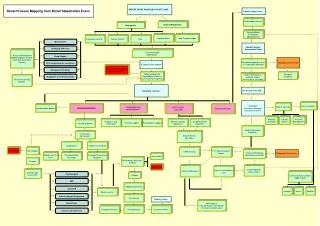
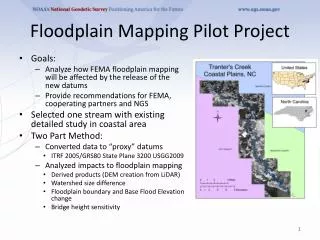
Renal Mapping Project. Dr Afzal Chaudhry Kirsty Smith James Hollinshead. Aims . Background to mapping project Uses of the maps Introduction to the maps Future plans. Background. Increasing use of maps in public health Examples: Teenage pregnancy Hospital episodes Cancer e-atlas

E N D
Renal Mapping Project Dr Afzal Chaudhry Kirsty Smith James Hollinshead
Aims • Background to mapping project • Uses of the maps • Introduction to the maps • Future plans
Background • Increasing use of maps in public health • Examples: • Teenage pregnancy • Hospital episodes • Cancer e-atlas • Interactive maps make the information more accessible
Renal mapping project • Collaboration between the Renal Registry and East Midlands Public Health Observatory • Renal Registry reports • Mapping software ‘instant atlas’ • On line access
Advantages of maps • Interactive and interesting • Can be used for: • Estimating need • Commissioning services • Identifying inequalities • Combining data: extension of dataset beyond that held by the Registry
Current maps available Single maps • RRT prevalence (direct and indirect) • Geography: LA or PCT Allows: • Trends • Area comparisons
Current maps available Double maps Allows the investigation of correlations • RRT prevalence (direct and indirect) • Geography: LA or PCT Can compare RRT rate with other factors • Deprivation • Ethnicity • CHD mortality
Current maps available Area profiles • PCT profile on one page • Two PCTs can be compared • Difference from national data displayed • Currently: • Calcium • Phosphate • Parathyroid Hormone
Future maps available Funnel Plots • Allow outlying areas to be identified • Data points are plotted on a graph with the mean value and “control limits” • Within control limits are performing as expected • Outside control limits are unexpectedly high or low
Progress to date Currently • Maps produced • On staging server (limited access) • Looking for feedback (working group) • Refine the maps with feedback • Place on public website • Increase data and update year on year