Effective Project Management in System Development
670 likes | 688 Views
Project management is crucial in the development of an information system, ensuring it meets user requirements within set timelines and budgets. It involves planning, organizing, directing, and controlling all project activities. This process is essential throughout the systems development life cycle. Project planning, estimating, and scheduling are key components of successful project management.

Effective Project Management in System Development
E N D
Presentation Transcript
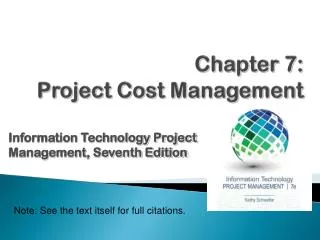
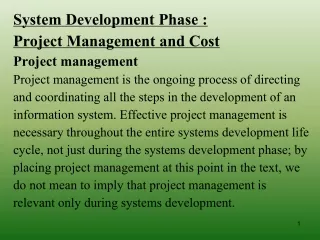
System Development Phase : Project Management and Cost Project management Project management is the ongoing process of directing and coordinating all the steps in the development of an information system. Effective project management is necessary throughout the entire systems development life cycle, not just during the systems development phase; by placing project management at this point in the text, we do not mean to imply that project management is relevant only during systems development.
Project management overview • The goal of project management is to produce an • information system that is acceptable to its end users and • that is developed within the specified time frame and • budget. The acceptability, deadline, and budget criteria • must all be met for a project to be considered completely • successful. Failing to meet any one of these three criteria • usually indicates a failure, at least in part, in project • management. Even though outside factors might • contribute significantly to project failure, the role of • project management is to recognize such factors and to • eliminate or minimize their negative effects.
The job of a project manager is to manage a project to • develop an information system. The project manager is • usually a member of the information systems • department, typically a senior systems analyst. The • project manager might also be called the project leader or • When appropriate, the lead analyst or the chief • programmer. • Most IS projects also have a project coordinator. The • project coordinator handles the administrative and • procedural responsibilities for the developing IS. This • person also negotiates between end users when they have • conflicting requirements and makes the final ruling on all
requests for change to the system requirements document • after the requirements have been frozen. • General management functions • In business today, the generally recognized management • functions are planning, staffing, organizing, directing, • and controlling. These five functions apply to all types of • managers in all kinds of situations; an information • system project manager is no exception.
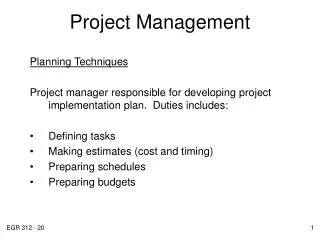
Project planning Project planning takes place at both the beginning and end of every SDLC phase. End-of-phase planning is necessary for formulating estimates of costs, manpower requirements, and schedules for all subsequent phases; these estimates, which are included in the documents prepared at the end of each phase, are used by management to decide on future action. Planning is necessary at the beginning of each phase to determine all the specific activities to be accomplished during that phase. An activity, or task, is any project-related work requiring the use of project
resources (personnel, time, or money) or any external effort that impacts the project. Examples of internal activities are conducting an interview, designing a report layout, and selecting equipment for purchase, whereas awaiting the delivery of purchase d equipment is an example of an external activity. An activity is the smallest unit of work over which the project manager desire control. An event is a project milestone representing the beginning or end of an activity. Each activity has two related events: one event represents the activity’s beginning, and the other event represents the activity’s
completion. Some events signal the end of one activity and the start of another activity. Project estimating Determining realistic time estimates for project activities is one of the most difficult of a project manager’s duties. The project manager must consider many factors that can affect time requirements. One of the most important of these factors is the size of the project, because the relationship between a project’s size and its required development resources is not proportional.
The attributes of individual project team members also affect time requirements. A team member with less experience, knowledge, education, maturity, and imagination requires more time to complete a project activity than does a more knowledgeable and experienced team member. Other examples of factors that can affect project time requirements include the attitudes and availability of end users, the level of upper management commitment, and the priority of the project compared to the priority of other projects in progress within the organization.
Most of the research done on estimating techniques concerns programming activities during the systems development phase. Project managers typically use one of three methods (or combination of these methods) to estimate programming times. These methods are the quantitative method, the experience method, and the constraint method. Project scheduling The project scheduling functions of the project manager include determining the order in which activities will be performed, setting start and end times for each activity, and assigning specific tasks to team members.
The first step in determining the order for • performing activities is to identify all activity • dependencies. To say that an activity is dependent • means that the activity cannot be started until one or • more of the other activities have been completed. • Scheduling tools • Several graphical planning aids can assist a project • manager in the scheduling process. We will examine two • of these tools: Gantt charts and PERT/CPM. • Gantt charts
Plan and Schedule - Await Hardware delivery - Programming - Install Hardware - Convert Files - Write User Manual - Program Testing - User Training - System Test - User Test - • 40 60 80 100 120 140 160 • Elapsed Time (in days) A Gantt chart
PERT/CPM • The Program Evaluation Review Technique (PERT) • Is a network model that allows for randomness in activity • completion times. PERT was developed by the Navy • Special Projects Office in the 1950s to control the • development of the Polaris submarine missile program. • At approximately the same time, the Critical Path • Method (CPM) was developed by private industry to • meet similar project management needs. The important • distinctions between the two methods have disappeared • over time, so today the technique is generally called • PERT/CPM.
PERT/CPM Activity Description Activity Duration 1 2 EVENT 1 ACTIVITY EVENT 2 3 4 EVENT 3 DUMMY ACTIVITY EVENT 4
Example 3 B A D 1 5 6 2 C 4
Example C 2 5 A D 4 1 B 3
PERT/CPM ProgrammingProgram Testing System Test 2 4 8 10 70 30 25 Plan and Schedule5 5 User Training User Test 1 7 9 11 20 25 Await Hardware Delivery Write User Manual 18 25 Install Hardware 3 5 10 Convert files 25 6
Activity duration • Traditional PERT techniques use a formula for • calculating estimated activity duration. The project • manager first determines three time estimates for each • activity: • Optimistic time (O) – generally the shortest time in • which the activity can be completed. • Most likely time (M) – the completion time having the • highest probability. • Pessimistic estimate (P) – the longest time that an • activity might require.
Optimistic time (O) • เวลาที่สั้นที่สุดที่งานหนึ่งๆจะเสร็จเมื่อทุกสิ่งทุกอย่าง • ดำเนินไปอย่างราบรื่น • โอกาสที่งานนี้จะเสร็จเร็วกว่าเวลา “O” มี Prob. = 0.01 • Most likely time (M) • เวลาที่เกิดบ่อยที่สุดเป็นปกติวิสัยในการทำการอย่างใดอย่าง • หนึ่งเมื่องานดำเนินไปอย่างราบรื่นและพบอุปสรรคสลับกัน • โอกาสที่งานนี้จะเสร็จเร็วหรือช้ากว่าเวลา “M” มี Prob. = • 0.02
Pessimistic estimate (P) • เวลาที่ยาวนานที่สุดที่งานหนึ่งๆ ได้เสร็จสิ้นลง เมื่องานดำเนิน • ไปแต่มีอุปสรรค • โอกาสที่งานนี้จะเสร็จช้ากว่าเวลา “P” มี Prob. = 0.01 • The expected activity duration is then calculated as : Te
For example, the project manager might estimate that a file-conversion activity could be completed in as few as twenty days or could take as many as thirty-four days, but is most likely to require twenty-four days. Using the formula, the expected activity duration is 25 days from the calculation: = 25
การหาเวลาเริ่มต้นเร็วที่สุด ( Earliest Start Time : ES ) เวลาเร็วที่สุดที่กิจกรรมถัดไปจะเริ่มต้นได้หลังจากที่กิจกรรมก่อน หน้านี้ได้เสร็จสิ้นไปหมดแล้วทุกกิจกรรม • ESi = เวลาเริ่มต้นที่เร็วที่สุด ณ เหตุการณ์ i • ESj = เวลาเริ่มต้นที่เร็วที่สุด ณ เหตุการณ์ j • Dij= ระยะเวลาในการทำงาน (ij) เริ่มจาก i ไปจนเสร็จ • สมบูรณ์ที่ j • สัญลักษณ์ที่ใช้คือ ซึ่งเขียนไว้ที่ Node
(ES2) 3 (ES1) (ES4) (ES5) 2 0 B,4 13 10 A,3 E,3 4 5 1 D,5 C,5 3 5 (ES3)
การหาเวลาเสร็จงานช้าที่สุด(Latest Completion Time : LT ) เวลาที่น้อยที่สุดจากหลายๆงานที่ออกจากเหตุการณ์นั้น โดยคิดลด เวลานับจากเวลาสิ้นสุดโครงการไปจนถึงเหตุการณ์นั้นออก • LTi = เวลาเสร็จงานช้าที่สุด ณ เหตุการณ์ i • LTj = เวลาเสร็จงานช้าที่สุด ณ เหตุการณ์ j • Dij= ระยะเวลาในการทำงาน (ij) เริ่มจาก i ไปจนเสร็จ • สมบูรณ์ที่ j • สัญลักษณ์ที่ใช้คือ ซึ่งเขียนไว้บน
(LT2) 6 3 (LT1) (LT5) 0 (LT4) 10 13 2 0 B,4 13 10 A,3 E,3 4 5 1 D,5 C,5 3 (LT3) 5 5
Critical path The critical path has been defined as the path with the most time required from the start to the finish of the project. The critical path can be derived by tracing the total duration time for all tasks for every path from the start to the end of the project. The path with the longest duration time is the critical path. From example: The critical path is : 1-2-4-8-10-9-11
Cost considerations • Throughout the entire systems development life cycle, • project managers and system analysts must be concerned • with costs. Estimates of projected costs and benefits must • be determined at the end of each SDLC phase as input to • the end-of-phase management decision. • Cost classifications • Costs can be classified as tangible or intangible, direct • or indirect, and fixed or variable.
Benefit considerations Recognizing and understanding the various classifications of benefits is helpful when you want to identify all the benefits of an IS project. Like costs,
benefits can be classified as tangible or intangible, fixed or variable, and direct or indirect. Another useful benefit classification relates to the source of the benefit: positive benefits versus cost-avoidance benefits. Positive benefits are those that increase revenues, improve services to customers or employees, or otherwise contribute to the organization or its image as a direct result of the performance of the IS. Examples of positive benefits include improved information availability, greater flexibility, faster service to customers, support for new products or capabilities, and better inventory management.
Frequently, an information systems project is initiated in order to eliminate the high costs of a current operation. The new system is expected to provide significant cost-avoidance benefits. Examples of cost- avoidance benefits include reduced clerical cost and reduced overtime wages. In general, a new information system will achieve cost-avoidance benefits equal to all the operating costs of the system that it replaces. Cost-avoidance benefits are as important and as real as positive benefits. You must consider both types of benefits when you perform cost-benefit analyses.
Cost-benefit analysis • After the costs and benefits have been identified and • quantified, the next step is a cost/benefit analysis, in which • each cost or benefit is evaluated in relation to each • alternative. Numerous methods are used to accomplish this • task. The following are some cost/benefit analysis • methods: • Pay-back analysis • Break-Even analysis • Present value analysis • Net Present Value analysis • Depreciation model
Pay-back analysis • Pay-back analysis determines the time it takes for • the benefits to equal the initial investment. With this • method the analyst calculates how long it takes for the • benefits to pay back the costs incurred during development • and usage. The simplest form of this determination is : • Pay-back = Investment • After-tax yearly savings • For example, assume that a project requires an initial • investment of $1,000,000 with a yearly after-tax savings of • $250,000 resulting from completion of the project. The • formula now becomes
For example, assume that a project requires an initial investment of $1,000,000 with a yearly after-tax savings of $250,000 resulting from completion of the project. The formula now becomes Pay-back = 1,000,000 250,000 = 4 years
Example of simple payback, consider the lighting retrofit of a 10,000-square-foot commercial office building. relamping with T-8 lamps and electronic, high-efficiency ballasts may cost around $13,300 ($50 each for 266 fixtures) and produce annual savings of around $4,800 per year (80,000 kWh at $0.06/kWh). The simple payback time for this improvement would be : payback = $13,000/$4,800 = 2.8 That is, the improvement would pay for itself in 2.8 years
Break-Even analysis Costs in $ Current system Proposed system $20,000 Return on investment Fix costs Investment 0 1,000 Units Break-Even analysis
Present value analysis and Net Present Value analysis • The cost/benefit formulas that consider present and • future values of money. • Future value formula • F = P(1 + i)n • Present value formula • P = F • (1 + i)n • Where P = principal sum or present value • F = future value, compounded amount of the • principal sum • i = nominal rate of interest • n = number of interest periods
Programming, Testing, and Documentation • During the system development phase, programmers • code, test, and document individual programs; the systems • analyst oversees these activities. • Program development • Planning the overall design strategy • Use top-down (modular) approach and partition the system into subsystems and modules • Develop programs and modules • Design, code, test, and document
Programming, Testing, and Documentation • During the system development phase, programmers • code, test, and document individual programs; the systems • analyst oversees these activities. • Program development • Planning the overall design strategy • Use top-down (modular) approach and partition the system into subsystems and modules • Develop programs and modules • Design, code, test, and document
Test the system • Link test • System test • Complete all documentation
Documentation • Documentation is the written material that explains what • the information system does and how people interact with • the system. • Type of documentation • Program documentation • System documentation • Operations documentation • End user documentation
Testing Programmers are responsible for unit testing the individual programs they develop. After the programmers have tested each program, then the programs within the system that depend on one another must be tested together, and finally the entire system must be tested.
Management Approval • After system testing is complete, the results are presented to management • Test results • Status of all required documentation • Input from users who participated • Detailed time schedules, cost estimates, and staffing requirements • If approved, a schedule for system installation and evaluation will be established
System Implementation and Evaluation • Phase : • Installation and evaluation completes the systems implementation phase • The new system is now ready to be used • Remaining tasks • Prepare an operational environment and install the new system • Provide training for users, IS staff, and managers • Perform file conversion and system changeover • Carry out post-implementation evaluation • Present a final report to management
Operational and Test Environments • Test environment • Programmers and analysts use the test environment to develop and maintain programs • The test environment contains copies of • Programs • Procedures • Test data files
Operational and Test Environments • Operational environment • Also called the production environment • Access is limited to information system users • IS staff enter the production environment only to correct problems or perform authorized work • Live, actual data is used • All changes must be verified and user approval obtained
Operational and Test Environments • Preparation of the operational environment • Examine all system components that affect system performance • Hardware and software configurations • Operating system programs and utilities • Network resources • Check all communications features, both before and after loading programs • Include network specifications in documentation