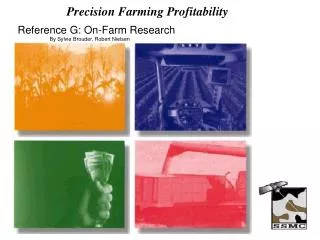
Precision Farming Profitability
Precision Farming Profitability. Reference G: On-Farm Research By Sylvie Brouder, Robert Nielsen. Replicate number. Note: Cannot tell if yields reflect something about the treatment, something about the field gradient or some about both factors.

Precision Farming Profitability
E N D
Presentation Transcript
Precision Farming Profitability Reference G: On-Farm Research By Sylvie Brouder, Robert Nielsen
Replicate number Note: Cannot tell if yields reflect something about the treatment, something about the field gradient or some about both factors. Note: Completely random assignment of treatments may still result in bias. Here, purely by chance, more of the A treatments are upslope from B Treatments. Treatment A Treatment A A B Treatment B Treatment B C Treatment A Treatment B Rep.1 Rep.2 Rep.3 Rep.4 For most trials, randomization of treatments within each replicate is the best option. Figure 1a. Side-by-side comparison: no replication. B. Completely randomized design w/4 replicates. C. Randomized block design w/4 replicates. Precision Farming Profitability, p. 104
Case 1: No difference in yields. Case 2: No difference in average yields but replicates vary. Figure 2. Three cases where statistics are not needed to interpret the results from a 2 treatment trial with 4 replicates. Case 3: Treatment B out-yields Treatment A in every replicate. Precision Farming Profitability, p. 106
Case 4: Treatment B yields more than Treatment A in 3 replicates but yields are the same in one replicate. Case 5: Treatment B out-yields A in 3 replicates but A out-yields B in 1 replicate. Figure 3. Three cases where statistics are most likely needed to correctly interpret the results from a 2 treatment trial with 4 replicates. Case 6: Results in individual replicates are mixed but Treatment B averages 5 bu/acre more than treatment A. Precision Farming Profitability, p. 107
Table 2. Understanding the probability. Precision Farming Profitability, p. 108
Table 3. In each case average yields in Treatment B are greater than A. Test your statistical IQ by figuring the odds that the Treatment B cases are really no different than Treatment A. In cases 6-10 look at only the first 3 replicates of Treatment A. Precision Farming Profitability, p. 109
Figure 4. Design for an on-farm trial comparing 2 treatments using 4 replicates. Treatments are randomized within each replicate. Precision Farming Profitability, p. 110
Replicates 1 2 3 4 Treatment A Treatment B Treatment C 1 Figure 5. Design for an on-farm trial comparing 3 treatments using 4 replicates. Treatments are randomized withi9n each replicate, and replicates are located so as to avoid known areas of extreme variability. Precision Farming Profitability, p. 110
Figure 6. Design for an on-farm trial using the “split-planter” approach. This layout shows the equipment passes when planter and combine widths are the same. Precision Farming Profitability, p. 111