Download
1 / 1
10 likes | 136 Views
Temperature and Salinity. Vertical Tracer Profile. Contaminant Discharge. Residual Circulation?. Mass inventory of SF 6 in Newark Bays and the Kills. Net loss rate of 26% per day ( = 0.30) is a combination of gas exchange and tidal flushing.

E N D
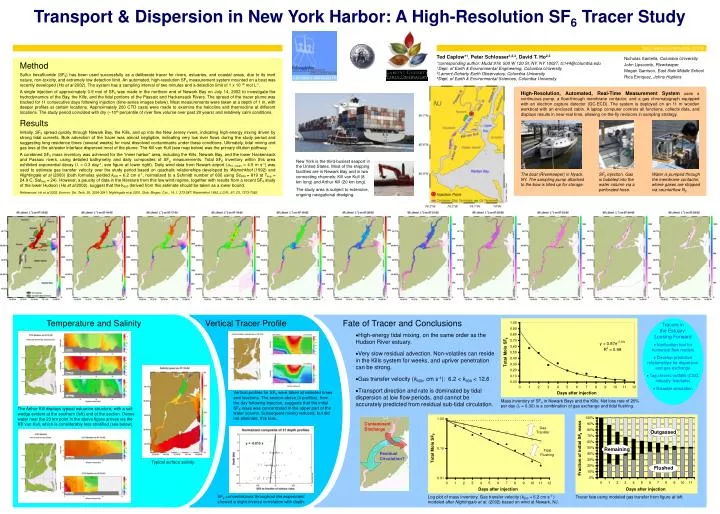
Temperature and Salinity Vertical Tracer Profile Contaminant Discharge Residual Circulation? Mass inventory of SF6 in Newark Bays and the Kills. Net loss rate of 26% per day ( = 0.30) is a combination of gas exchange and tidal flushing. Log plot of mass inventory. Gas transfer velocity (k600 = 6.2 cm s-1 ) modeled after Nightingale et al. (2002) based on wind at Newark, NJ. Tracer fate using modeled gas transfer from figure at left. http://www.columbia.edu/~tc144 Ted Caplow*1, Peter Schlosser1,2,3, David T. Ho2,3 *corresponding author: Mudd 918, 500 W 120 St, NY, NY 10027, tc144@columbia.edu 1Dept. of Earth & Environmental Engineering, Columbia University 2Lamont-Doherty Earth Observatory, Columbia University 3Dept. of Earth & Environmental Sciences, Columbia University Nicholas Santella, Columbia University John Lipscomb, Riverkeeper Megan Garrison, East Side Middle School Rica Enriquez, Johns Hopkins Method Sulfur hexafluoride (SF6) has been used successfully as a deliberate tracer for rivers, estuaries, and coastal areas, due to its inert nature, non-toxicity, and extremely low detection limit. An automated, high-resolution SF6 measurement system mounted on a boat was recently developed (Hoet al 2002). The system has a sampling interval of two minutes and a detection limit of 1 x 10-14 mol L-1. A single injection of approximately 0.9 mol of SF6 was made in the northern end of Newark Bay on July 14, 2002 to investigate the hydrodynamics of the Bay, the Kills, and the tidal portions of the Passaic and Hackensack Rivers. The spread of the tracer plume was tracked for 11 consecutive days following injection (time-series images below). Most measurements were taken at a depth of 1 m, with deeper profiles at certain locations. Approximately 200 CTD casts were made to examine the halocline and thermocline at different locations. The study period coincided with dry (~10th percentile of river flow volume over past 20 years) and relatively calm conditions. Results Initially, SF6 spread quickly through Newark Bay, the Kills, and up into the New Jersey rivers, indicating high-energy mixing driven by strong tidal currents. Bulk advection of the tracer was almost negligible, indicating very low river flows during the study period and suggesting long residence times (several weeks) for most dissolved contaminants under these conditions. Ultimately, tidal mixing and gas loss at the air/water interface dispersed most of the plume. The Kill van Kull (see map below) was the primary dilution pathway. A combined SF6 mass inventory was achieved for the “inner harbor” area, including the Kills, Newark Bay, and the lower Hackensack and Passaic rivers, using detailed bathymetry and daily composites of SF6 measurements. Total SF6 inventory within this area exhibited exponential decay ( = 0.3 day-1; see figure at lower right). Daily wind data from Newark airport (u10, mean = 4.5 m s-1) was used to estimate gas transfer velocity over the study period based on quadratic relationships developed by Wanninkhof (1992) and Nightingaleet al (2000) (both formulas yielded k600= 6.2 cm s-1, normalized to a Schmidt number of 600 using ScSF6= 819 at Tavg = 24.9 C, Salavg = 24). However, a paucity of data in the literature from this low wind regime, together with results from a recent SF6 study of the lower Hudson (Hoet al 2002), suggest that the k600 derived from this estimate should be taken as a lower bound. References: Ho et al 2002, Environ. Sci. Tech. 36, 3234-3241; Nightingale et al 2000, Glob. Biogeo. Cyc., 14, 1, 373-387; Wanninkhof 1992, J.G.R., 97, C5, 7373-7382. Transport & Dispersion in New York Harbor: A High-Resolution SF6 Tracer Study High-Resolution, Automated, Real-Time Measurement Systemuses a continuous pump, a flow-through membrane contactor, and a gas chromatograph equipped with an electron capture detector (GC-ECD). The system is deployed on an 11 m wooden workboat with an enclosed cabin. A laptop computer controls all functions, collects data, and displays results in near-real time, allowing on-the-fly revisions in sampling strategy. New York is the third-busiest seaport in the United States. Most of the shipping facilities are in Newark Bay and in two connecting channels: Kill van Kull (8 km long) and Arthur Kill (20 km long). The study area is subject to extensive, ongoing navigational dredging. The boat (Riverkeeper) in Nyack, NY. The sampling pump attached to the bow is tilted up for storage. SF6 injection. Gas is bubbled into the water column via a perforated hose. Water is pumped through the membrane contactor, where gases are stripped via counterflow N2. Fate of Tracer and Conclusions • Tracers in • the Estuary: • Looking Forward • Verification tool for numerical flow models • Develop predictive relationships for dispersion and gas exchange • Tag chronic outfalls (CSO, industry, leachate) • Disaster simulation • High-energy tidal mixing, on the same order as the Hudson River estuary. • Very slow residual advection. Non-volatiles can reside in the Kills system for weeks, and upriver penetration can be strong. • Gas transfer velocity (k600, cm s-1): 6.2 < k600 < 12.6 • Transport direction and rate is dominated by tidal dispersion at low flow periods, and cannot be accurately predicted from residual sub-tidal circulation. Vertical profiles for SF6 were taken at selected times and locations. The section above (4 profiles), from the day following injection, suggests that the initial SF6 mass was concentrated in the upper part of the water column. Subsequent mixing reduced, but did not eliminate, this bias. The Arthur Kill displays typical estuarine structure, with a salt wedge evident at the southern (left) end of the section. Dense water near the 23 km point in the above figure arrives via the Kill van Kull, which is considerably less stratified (see below). Typical surface salinity. SF6 concentrations throughout the experiment showed a slight inverse correlation with depth.