Download
1 / 77
810 likes | 1.09k Views
High Resolution Site Characterization and the Triad Approach. Seth Pitkin Triad Investigations: New Approaches and Innovative Strategies June 2008. Contents. Spatial Variability in Porous Media 2 Contaminants in Fractured Rock 3 High Resolution Site Investigations.

E N D
High Resolution Site Characterization and the Triad Approach Seth Pitkin Triad Investigations: New Approaches and Innovative Strategies June 2008
Contents • Spatial Variability in Porous Media 2 Contaminants in Fractured Rock 3 High Resolution Site Investigations
Gasoline Plume Site in VermontVariability of Hyd. Gradient w/ Depth Shallow – 585 ft amsl Intermediate – 574 ft amsl Deep – 557 ft amsl
Hydrodynamic Dispersion • Natural Gradient Tracer Tests • Stanford/Waterloo – 1982 • USGS Cape Cod – 1990(?) • Rivett et al 1991 • Dispersion is scale (time/distance) dependent • Transverse horizontal dispersion is weak • Transverse vertical dispersion is even weaker • Longitudinal dispersion is significant “Sudicky Star” Stanford-Waterloo Natural Gradient Tracer Test Layout
Rivett’s Experiment:The Emplaced Source Site Rivett et al, 2000
TCM Plume at 322 DaysWeak Transverse Dispersion Rivett et al, 2000
Distribution of K at CFB Borden - Beach Sand(adapted from Sudicky, 1986) 1279 K measurements Mean K= 9.75x10⁻³ cm/sec Range = one order of magnitude
Mass Flux Distribution Guilbeault et. al. 2005 75% of mass discharge occurs through 5% to 10% of the plume cross sectional area. Optimal Spacing is ~0.5 m
Contents 1 Spatial Variability in Porous Media 2 Contaminants in Fractured Rock 3 High Resolution Site Investigations
Dual Porosity Media mineral particle A Primary Porosity in the Matrix 2% - 25% Secondary Porosity in the Fractures 0.1% - 0.001%
DNAPL Disappearance from Fractures by DiffusionParker et al.,Ground Water (1994) Fracture Aperture 2b H O f 2 f f f f f DNAPL m f f f m m F racture D issolved D issolved S pacing P hase P hase Early Intermediate Later Time
Nature of Contamination in Fractured Porous Media SOURCE PLUME ZONE ZONE vadose zone groundwater zone PLUME FRONT B.L. Parker
Contents 1 Spatial Variability in Porous Media 2 Contaminants in Fractured Rock 3 High Resolution Site Investigations
High Resolution Approach • Transect: Line of vertical profiles oriented normal to the direction of the hydraulic gradient (Horizontal spacing) • Short Sample Interval: Vertical dimension of the sampled portion of the aquifer • Close Sample Spacing: Vertical distance between samples • Real-time/Near Real-time Tools • Dynamic/ Adaptive Approach
High Resolution Tools • Cone Penetrometer • Laser Induced Fluorescence (LIF, aka UVOST, TarGOST) • Membrane Interface Probe (MIP) • NAPL Ribbon Sampler • WaterlooAPS • Soil Coring and Subsampling • On Site Analytical • Bedrock Toolbox • COREDFN • Borehole Geophysics • FLUTe K Profiler • Multilevels (Westbay, Solinst, FLUTe)
Collaborative Data in Porous Media:MIP, WaterooAPS, Soil Subcore Profiling and Onsite Analytical • MIP: Rapid screening tool • Use to rapidly screen site and select sample locations for detailed difinitive sampling • WaterlooAPS: Detailed definitive data in aquifers • Soil Subcore Profiling: Detailed definitive data in aquitards • On site analytical: Near real-time defensible data
Spatial Relationships of K and C Source Area Down Plume
Waterloo Profiler: Near Real-Time Closely Spaced Profile Ik Head 1,2-DCE 1,1,1-TCA TCE PCE
Soil Sub-Core Sampling: Near- Real Time, Closely Spaced Profile
Rock Core Sampling High resolution VOC sampling Physical property sampling Sampled Core Runs Physical Property Sample VOC Sample
TCE mg/L cored hole rock core 0 1 10 100 fractures core non-detect samples 1 analyzed 2 Fractures with 3 TCE migration 4 5 6 Core Sampling for Mass Distribution & Migration Pathway Identification B.L. Parker
Step 4. Rock crushing Step 1. Core HQ vertical hole Hydraulic Rock Crusher Sample length: ~1-2 inches Step 5. Fill sample bottle with crushed rock and extractant MeOH Step 2. Core logging and inspection Crushed rock Step 6. Microwave of sample for extraction of analyte, and then analysis Step 3. Sample removal from core Step 7. Conversion to Porewater concentration B.L. Parker (Modified from Hurley, 2002)
Example Rock Core VOC Concentration Profiles Siltstone (Union, NY) Shale (Watervliet, NY) Sandstone (California) B.L. Parker
Long extraction time for shake-flask method – Not Very Real-Time Guelph Samples TCE Data from Yongdong Liu (2005)
Microwave Assisted Extraction (MAE) • Fast - 40 min • Extraction at higher temperature and pressure • Increases diffusion rate and analyte desorption rate • Elevated boiling point (temperatures ~ 120ºC) • Increased solvent penetration B.L. Parker Photos courtesy of Dr. Tadeusz Górecki
Shake Flask vs MAE (TCE) Good correlation More complete extraction with MAE Corehole MW-367-5 Shake-flask MAE B.L. Parker
Distillation • Contaminant hydrogeology is all about spatial variability • High resolution site characterization is essential • Apply Triad Approach Principles: • Real-time/ near real time data collection tools • Dynamic Work Strategy • Employ collaborative data using integrated tool sets • Triad Approach in Bedrock Plumes: Coming Soon to a Fractured Rock Aquifer Near you THE END
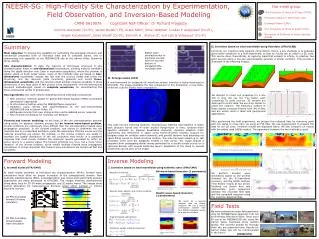
Hydraulic Parameter and Mass Flux Distribution Using the High-Resolution Piezocone and GMS Dr. Mark Kram, Groundswell Dr. Norm Jones, BYU Jessica Chau, UConn Dr. Gary Robbins, UConn Dr. Amvrossios Bagtzoglou, UConn Thomas D. Dalzell, AMS Per Ljunggren, ENVI EPA Clu-In Internet Seminar 13 August 2009
TECHNICAL OBJECTIVES Demonstrate Use of High-Resolution Piezocone to Determine Direction and Rate of GW Flow in 3-D Compare with Traditional Methods Develop Models and Predict Plume Behavior Integrate High-Resolution Piezocone and Concentration Data into 3-D Flux Distributions via GMS Upgrades Introduce New Remediation Performance Monitoring Concept
TECHNOLOGY DESCRIPTION High-Resolution Piezocone: Direct-Push (DP) Sensor Probe that Converts Pore Pressure to Water Level or Hydraulic Head Head Values to ± 0.08ft (to >60’ below w.t.) Can Measure Vertical Gradients Simultaneously Collect Soil Type and K K from Pressure Dissipation, Soil Type Minimal Worker Exposure to Contaminants System Installed on PWC San Diego SCAPS Licensed to AMS Custom Transducer
SEEPAGE VELOCITY AND FLUX Seepage velocity (): Ki where: K = hydraulic conductivity (Piezocone) = ------ (length/time) i = hydraulic gradient (Piezocone) = effective porosity (Piezocone/Soil) Contaminant flux (F): F = [X] where: = seepage velocity (length/time; m/s) (mass/length2-time; mg/m2-s) [X] = concentration of solute (MIP, etc.) (mass/volume; mg/m3)
CONCENTRATION VS. FLUX Length F,
CONCENTRATION VS. FLUX Length F, High Concentration High Risk!! Hydraulic Component - Piezocone
GMS MODIFICATIONS Gradient, Velocity and Flux Calculations • Convert Scalar Head to Gradient [Key Step!]
GMS MODIFICATIONS Gradient, Velocity and Flux Calculations • Convert Scalar Head to Gradient [Key Step!]
GMS MODIFICATIONS Gradient, Velocity and Flux Calculations • Convert Scalar Head to Gradient [Key Step!] • Merging of 3-D Distributions to Solve for Velocity • Merging of Velocity and Concentration (MIP or Samples) Distributions to Solve for Contaminant Flux
APPROACH • Test Cell Orientation • Initial pushes for well design; • Well design and prelim. installations, gradient determination; • Initial CaCl2 tracer tests with geophysics (time-lapse resistivity) to determine general flow direction • Field Installations (Clustered Wells) • Survey (Lat/Long/Elevation) • Pneumatic and Conventional Slug Tests (“K – Field”) • Modified Geoprobe test system • Water Levels (“Conventional” 3-D Head and Gradient) • HR Piezocone Pushes (K, head, eff. porosity) • GMS Interpolations (, F), Modeling and Comparisons
CPT-BASED WELL DESIGN Candidate Screen Zone Kram and Farrar Well Design Method