Download
1 / 8
80 likes | 184 Views
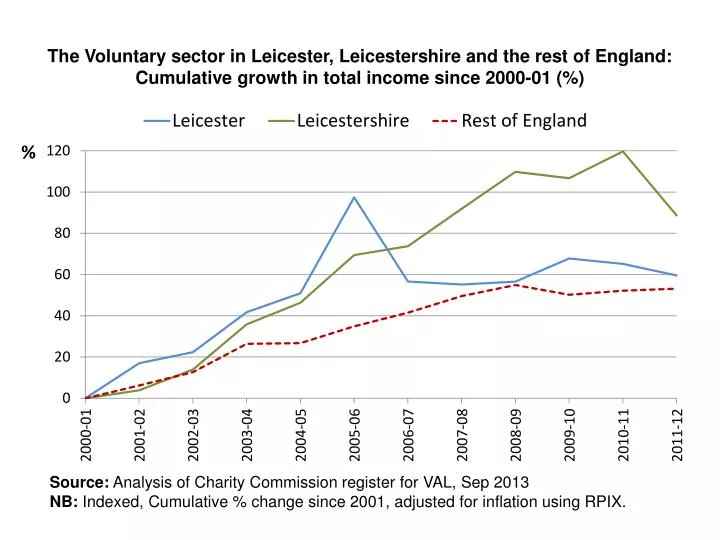
The Voluntary sector in Leicester, Leicestershire and the rest of England: Cumulative growth in total income since 2000-01 (%). %. Source: Analysis of Charity Commission register for VAL, Sep 2013 NB: Indexed, Cumulative % change since 2001, adjusted for inflation using RPIX.

E N D
The Voluntary sector in Leicester, Leicestershire and the rest of England: Cumulative growth in total income since 2000-01 (%) % Source: Analysis of Charity Commission register for VAL, Sep 2013 NB: Indexed, Cumulative % change since 2001, adjusted for inflation using RPIX.
Asking local authorities through FOI requests…. Source: Compact Voice, FOI requests http://www.compactvoice.org.uk/foi2012
Income from statutory grants and contracts – all UK voluntary sector 2001-2011 Contracts Grants Source: NCVO UK Civil Society Almanac 2013, data.ncvo-vol.org.uk
How does the 2011-12 income of Charnwood compare to other districts?
Number of £ income to VCS per head of the population per district (2011-12)
Conclusion • Income to the VCS in Leicestershire has grown more than average, but shows signs of declining • Both grants and contracts are down, but the general trend is to commission through contracts • The Charnwood VCS has a relatively stable number of charities • The Charnwood VCS has a higher income than other Leicestershire districts