Download
1 / 1
10 likes | 129 Views
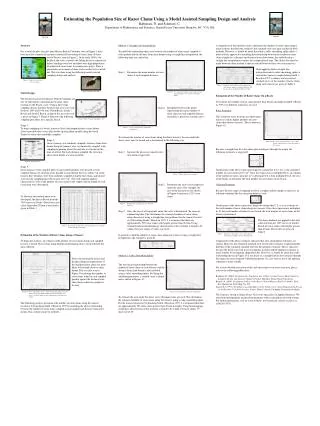
Figure 1: Map of south western coast of Canada. TRUE OR. FALSE??. Figure 2: Pacific razor clam. Table 2: Estimates of the number of razor clams along each transect sampled on South 1 Beach in 1995 for razor clams greater than 20 mm in length.

E N D
Figure 1: Map of south western coast of Canada TRUE OR... FALSE?? Figure 2: Pacific razor clam Table 2: Estimates of the number of razor clams along each transect sampled on South 1 Beach in 1995 for razor clams greater than 20 mm in length. Figure 6: Plot of the mean number of razor clams at each sampled distance versus distance from chart datum. Figure 3: Map of beaches near Masset, BC. Figure 4: Sampled beach. Figure 7: Curve produced using a straight line interpolation. Figure 10: Plot of the estimated number of razor clams along a sampled transect versus the length of the transect. Figure 8: Trapezoidal sections produced. Table 1: Raw data from 1995 survey of South 1 Beach for razor clams greater than 20 mm in length. Figure 9: Hatched section displays the area of the first trapezoid. Table 3: Estimates of the number of razor clams greater than 20 mm in length on South 1 Beach in 1995. Figure 5: Plots of the number of razor clams sampled per quadrat versus the distance from chart datum using data collected from the 1995 survey of South 1 Beach for razor clams greater than 20 mm in length. Figure 10: Curve produced a cubic smoothing spline. Estimating the Population Size of Razor Clams Using a Model Assisted Sampling Design and AnalysisBabineau, D. and Schwarz, C.Department of Mathematics and Statistics, Simon Fraser University, Burnaby, BC V5A 1S6 AbstractFor several decades, beaches near Masset, British Columbia, seen in Figure 1, have been used for commercial and non commercial harvesting of razor clams (Siliqua patula Dixon), seen in Figure 2. In the early 1990’s, the health of the stock seemed to be failing because commercial fishery landings were low and there were high proportions of undersized razor clams in commercial catches. Thus, a quantitative assessment of clam stocks needed to be carried out. This was done using the following model assisted sampling design and analysis.Study DesignThe beaches located near Masset, British Columbia areone of eight major concentrations of razor clamsexisting on the Pacific coast. Using a three stage sampling design, the three beaches that were surveyedbetween 1994 and 1996 were North Beach, South 1 Beach and South 2 Beach. A map of the area surveyedis given in Figure 3. Figure 4 illustrates the followingsampling procedure for a specific beach.Stage 1:To begin sampling of a beach, transects (lines laid perpendicular to chart datum(lowest possible tide)) were allocated by spacing them equally along the beach.Transects where then randomly sampled. Stage 2: Once a transect was randomly sampled, distances from chart datum along the transect were systematically sampled, with sampling beginning where the surf line was located at the time of arrival. For each distance sampled, the elevation above chart datum was also recorded.Stage 3:Once distances were sampled, plots of sand called quadrats were located at eachsampled distance by drawing a line parallel to chart datum that was within 7 m of thetransect line. Quadrats were then randomly sampled along the line using a galvanizedsteel circular sampling ring with an area of 0.5 m2 . For each sampled quadrat,characteristics such as the number of razor clams in the sample and the length of eachrazor clam were determined.To illustrate the method about to be developed, the data collected from the 1995 survey of South 1 Beach for razorclams larger than 20 mm is used and is given in Table 1.Estimation of the Number of Razor Clams Along a TransectTo begin the analysis, an estimate of the number of razor clams along each sampledtransect is found. This is done using biological information that is extracted from thedata collected. Due to environmental factors and the physiological requirements of the organism,razor clams are more likely to be found closer to chart datum. This is easily seen in Figure 5 by plotting the number of razor clams found in each sampled quadrat against the distance from chart datum where the quadrat is located.The following analysis determines the number of razor clams along the transectlocated at 0.8 km along South 1 Beach in 1995 by modeling the above relationship between the number of razor clams sampled at each quadrat and distance from chart datum. This is done using two methods. Method 1: Straight Line InterpolationTo model the relationship that exists between the number of razor clams sampled ateach quadrat and the distance from chart datum using a straight line interpolation, thefollowing steps are carried out.Step 1: Determine the mean number of razor clams at each sampled distance. Step 2: Interpolate between the points representing the mean number of razor clams at each sampled distance to produce a piecewise smooth curve.To estimate the number of razor clams along the above transect, the area under theabove curve must be found and is determined in the following way.Step 1: Separate the piecewise smooth curve into distinct trapezoids. Step 2: Determine the area of each trapezoid under the curve. For example, the area of the hatched section shown in Figure 9 represents 122.5 razor clams.Step 3: Once the area of all trapezoids under the curve is determined, the areas are summed together. This determines the estimated number of razor clams along the transect using a straight line interpolation. For the transect located at 0.8 km along South 1 Beach in 1995, it is estimated that there are approximately 585 razor clams with lengths greater than 20 mm. Using standard statistical methodology, the precision of this estimate is found to be within 183 razor clams, 19 times out of 20.In general, to find the number of razor clams along any transect using a straight lineinterpolation, the estimate is given byMethod 2: Cubic Smoothing SplineThe non linear relationship between thenumber of razor clams at each distance and thedistance from chart datum is also modeledusing a cubic smoothing spline. By fixing thesmoothing parameter, a smooth curve is foundand is shown in Figure 10.To estimate the area under the above curve, Riemann sums are used. This determines the estimated number of razor clams along the transect using a cubic smoothing spline.For the transect located at 0.8 kmalong South 1 Beach in 1995, it is estimated that thereare approximately 583 razor clams greater than 20 mm in length. Using bootstrapping techniques, the precision of this estimate is found to be within 138 razor clams, 19 times out of 20. A comparison of the methods used to determine the number of razor clams along a transect shows that both the estimates and standard errors are quite similar for bothmethods. However, it should be noted that while a cubic smoothing spline offers amore realistic approach to modeling the relationship between the number of razorclams sampled at a distance and distance from chart datum, the method using a straight line interpolation requires less computational time. The choice that must be made between either method is than a trade off between these two characteristics.Upon applying both a straight line interpolation and a cubic smoothing spline to each of the transects sampled along South 1 Beach in 1995, estimates and associated standard errors of the number of razor clams along each transect are given in Table 2.Estimation of the Number of Razor Clams On a BeachTo estimate the number of razor clams greater than 20 mm in length on South 1 Beachin 1995, two different estimators are used.Ratio EstimatorThis estimator stems from the fact that longer transects contain higher numbers of razorclams than shorter transects. This is shown inFigure 10.Because a straight line fit to the above plot would pass through the origin, thefollowing estimator is suggested.Justification of the above expression begins by noting that Ti / Li is the estimatednumber of razor clams per 0.5 m2. Once this expression is multiplied by 2, an estimateof the number of razor clams per m2 is determined. It is then multiplied by A, the areaof the beach, to determine the total number of razor clams on the beach.Inflation EstimatorBecause the first stage of sampling involves a simple random sample of transects, aninflation estimator like the one given below is used.Justification of the above expression begins by noting that Ti / n is an estimate ofthe total number of razor clams along any transect. Once this expression is multipliedby N, the total number of transects on a beach, the total number of razor clams on thebeach is determined. The above methods are applied to the data collected from the 1995 survey of South 1 Beach for razor clams with lengths greater than 20 mm. The results are given in Table 3.Comparison of the above estimates indicates that ratio and inflation estimates aresimilar. However, the estimated standard error for the ratio estimator is approximatelyhalf that of the estimated standard error for the inflation estimator. This is expectedbecause the beach surveyed in not rectangular in shape and the inflation estimator ismore suitable for rectangular shaped beaches. However, it should be noted that if therelationship shown in Figure 10 is not linear or a straight line fit does not pass throughthe origin, the ratio estimator will perform poorly. In cases such as these, the inflationestimator is more suitable.For a more detailed discussion of this and other analyses of razor clam data, pleaserefer to the following publications.Babineau, D. (2000). Estimating the Population Size of Razor Clams Using a Model Assisted Sampling Design and Analysis. Master’s Project. Burnaby: Simon Fraser University.Bourne, N. (1969). Population Studies on the Razor Clam at Masset, British Columbia. Fish. Res. Board Can. Tech. Rep. No. 232.Szarzi, N.J. (1991). Distribution and abundance of the Pacific razor clam (Siliqua patula Dixon), on theEastside Cook Inlet beaches, Alaska. Master’s thesis. Fairbanks: University of Alaska.The Statistics Group at Simon Fraser University specializes in Applied Statistics. Weoffer both undergraduate and graduate programs with co-op options for both streams.For further information, visit us at our website, www.math.sfu.ca/stats or call us at(604)291-3376.