Kyle Hogrefe continued
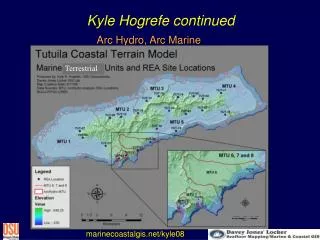
Kyle Hogrefe continued. Arc Hydro, Arc Marine. Terrestrial. marinecoastalgis.net/kyle08. Terrain Analysis. Slope ( Landslide susceptibility) Aspect ( Solar insolation, vegetation) Catchment or dispersal area ( Runoff volume, soil drainage) Flow path ( Distance of water flow to point)

Kyle Hogrefe continued
E N D
Presentation Transcript
Kyle Hogrefe continued Arc Hydro, Arc Marine Terrestrial marinecoastalgis.net/kyle08
Terrain Analysis • Slope (Landslide susceptibility) • Aspect (Solar insolation, vegetation) • Catchment or dispersal area (Runoff volume, soil drainage) • Flow path (Distance of water flow to point) • Profiles, fence diagrams • Viewshed (visibility) • Indices (e.g., TPI/BPI, rugosity)
1 2 3 4 5 6 7 8 9 Slope and Aspect • measured from an elevation or bathymetry raster • compare elevations of points in a 3x3 neighborhood • slope and aspect at one point estimated from its elevation and that of surrounding 8 points • number points row by row, from top left from 1 to 9
1 2 3 4 5 6 7 8 9 Typical Slope Calculation • b = (z3 + 2z6 + z9 - z1 - 2z4 - z7) / 8D • c = (z1 + 2z2 + z3 - z7 - 2z8 - z9) / 8D • b denotes slope in the x direction • c denotes slope in the y direction • D is the spacing of points (30 m) • find the slope that fits best to the 9 elevations • minimizes the total of squared differences between point elevation and the fitted slope • weighting four closer neighbors higher • tan (slope) = sqrt (b2 + c2)
Slope Definitions • Slope defined as an angle • … or rise over horizontal run • … or rise over actual run • various methods • important to know how your favorite GIS calculates slope
1 2 3 4 5 6 7 8 9 Aspect • tan (aspect) = b/c • b denotes slope in the x direction • c denotes slope in the y direction • Angle between vertical and direction of steepest slope • Measured clockwise • add 180 to aspect if c is positive, 360 to aspect if c is negative and b is positive
Benthic Terrain Modeler Dawn Wright Emily Lundblad*, Emily Larkin^, Ron Rinehart Dept. of Geosciences, Oregon State University Josh Murphy, Lori Cary-Kothera, Kyle Draganov NOAA Coastal Services Center GIS Training for Marine Resource Management Monterey, June 13, 2005 Photo by
Artwork by Jayne Doucette, Woods Hole Oceanographic Institution
FBNMS: Some Major Issues • Natural & human impacts • Crown-of-thorns invasion, hurricanes, bleaching • Illegal fishing, sewage outfall Photos courtesy of NOAA National Marine Sanctuary System
OrSt & USFEarliest Multibeam Surveys By OrSt grad student Emily Lundblad
Completed by NOAA CRED By OrSt grad student Kyle Hogrefe
(after Weiss 2001) Bathymetric Position Index(from TPI, Jones et al., 2000; Weiss, 2001; Iampietro & Kvitek, 2002) Measure of where a point is in the overall land- or “seascape” Compares elevation of cell to mean elevation of neighborhood
Bathymetric Position Index bpi<scalefactor>= int((bathy - focalmean(bathy, annulus, irad, orad)) + .5) Algorithm compares each cell’s elevation to the mean elevation of the surrounding cells in an annulus or ring. resolution = 3 m irad = 2 cells (6 m) orad = 4 cells (12 m) scalefactor = resolution * orad = 36 m |---2---| |---------4-------| • Negative bpi = depression • Positive bpi = crest • Zero bpi = constant slope or flat -3m-
Broadscale Zones from BPI A surficial characteristic of the seafloor based on a bathymetric position index value range at a broad scale & slope values. • Crests • (2) Depressions (3) Flats (4) Slopes if (B-BPI >= 100) out_zones = 1 else if (B-BPI > -100 and B-BPI < 100 and slope <= gentle) out_zones = 3
Finescale Structures from BPI A surficial characteristic of the seafloor based on a BPI value range at a combined fine scale & broad scale, slope & depth • Narrow depression 8. Open slopes • Local depression on flat 9. Local crest in depression • Lateral midslope depression 10. Local crest on flat • Depression on crest 11. Lateral midslope crest • Broad depression with an open bottom 12. Narrow crest • Broad flat 13. Steep slope • Shelf
BPI Zone and Structure Classification Flowchart Emily Lundblad, OrSt M.S. Thesis
Structure Classification Decision Tree Emily Lundblad, OrSt M.S. Thesis
Fish Abundance & BPI Courtesy of Pat Iampietro, CSU-MB, ESRI UC 2003
2005 HURL Sub & ROV surveys Ka‘imikai-o-Kanaloa Pisces IV or V RCV-150
Rugosity • Measure of how rough or bumpy a surface is, how convoluted and complex • Ratio of surface area to planar area Surface area based on elevations of 8 neighbors 3D view of grid on the left Center pts of 9 cells connected To make 8 triangles Portions of 8 triangles overlapping center cell used for surface area Graphics courtesy of Jeff Jenness, Jenness Enterprises, and Pat Iampietro, CSU-MB
BTM Methodology Step Two Step Three Step Four Step One Slope Classification Dictionary Benthic Terrain + Bathymetry Fine BPI + Broad BPI
Use of Terrain Analysis Tools • Look at version # (e.g., v. 1.0, and all that that implies!) • Careful study of your own data • BPI scale factors • Fledermaus Viz and Profile Control helped in conjunction • Customized classification schemes • ArcGIS 9.x w/ latest Service Pack? • > 2.0 GHz processor, > 1 Gb disk space
Animated Terrain Flyovers Dr. K, OSU and Aileen Buckley, ESRI
Our Tools Portal …dusk.geo.orst.edu/djl/samoa/tools.html Image courtesy of FBNMS
Other Resources • GEO 580 web site - links • GIS@OSU, “Data & Software” • www.geo.oregonstate.edu/ucgis/datasoft.html • Wilson and Gallant (ed.), Terrain Analysis • ESRI Virtual Campus library • campus.esri.com/campus/library
Gateway to the Literature • Guisan, A., Weiss, S.B., Weiss, A.D., 1999. GLM versus CCA spatial modeling of plant species distribution. Plant Ecology, 143: 107-122. • Jenness, J. 2003. Grid Surface Areas: Surface Area and Ratios from Elevation Grids [Electronic manual]. Jenness Enterprises: ArcView® Extensions. http://www.jennessent.com/arcview/arcview_extensions.htm • Jones, K., Bruce, et al., 2000. Assessing landscape conditions relative to water resources in the western United States: A strategic approach, Environmental Monitoring and Assessment, 64: 227-245. • Lundblad, E., Wright, D.J., Miller, J., Larkin, E.M., Rinehart, R., Battista, T., Anderson, S.M., Naar, D.F., and Donahue, B.T., A benthic terrain classification scheme for American Samoa, Marine Geodesy, 26(2), 2006. http://dusk.geo.orst.edu/mgd2006_preprint.pdf • Rinehart, R., D. Wright, E. Lundblad, E. Larkin, J. Murphy, and L. Cary-Kothera, 2004. ArcGIS 8.x Benthic Habitat Extension: Analysis in American Samoa. In Proceedings of the 24th Annual ESRI User Conference. San Diego, CA, August 9-13. Paper 1433. http://dusk.geo.orst.edu/esri04/p1433_ron.html • Weiss, Andy, 2001. Topographic Positions and Landforms Analysis (Conference Poster). ESRI International User Conference.San Diego, CA, July 9-13.
Gateway to the Literature Wright, D.J. and Heyman, W.D., 2008, Marine and coastal GIS for geomorphology, habitat mapping, and marine reserves, Marine Geodesy, 31(4): 1-8, 2009. Sappington, J.M., Longshore, K.M., Thompson. D.B., 2007, Quantifying landscape ruggedness for animal habitat analysis: A case study using bighorn sheep in the Mojave Desert. J. of Wildlife Management, 71(5): 1419-1427. Dunn, D.C. and Halpin, P.N., 2009, Rugosity-based regional modeling of hard-bottom habitat. Marine Ecology Progress Series, 377: 1-11. doi:10.3354/meps07839 Borruso, G., 2008. Network density estimation: A GIS approach for analysing point patterns in a network space. Transactions in GIS, 12(3): 377-402.