Download
1 / 18
180 likes | 320 Views
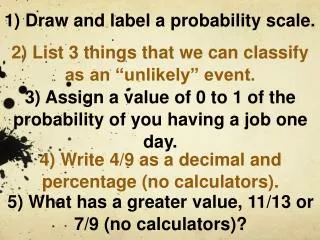
2 ) List 3 things that we can classify as an “unlikely” event. 3 ) Assign a value of 0 to 1 of the probability of you having a job one day. 1) Draw and label a probability scale. 4 ) Write 4/9 as a decimal and percentage (no calculators).

E N D
2) List 3 things that we can classify as an “unlikely” event. 3) Assign a value of 0 to 1 of the probability of you having a job one day. 1) Draw and label a probability scale. 4) Write 4/9 as a decimal and percentage (no calculators). 5) What has a greater value, 11/13 or 7/9 (no calculators)?
Not likely Likely Even Chance Certain Impossible
Relative Frequency in experiments… Outcome Frequency Relative Frequency = Total Frequency (all experiments)
Relative Frequency Table… 1 III 3 =3÷15 = 0.2 2 3 4 5 6 1.0
Fill out the relative frequency tables on your graphic organizer for 5, 25, and 50 dice rolls.
Relative Frequency Table… 1 III 3 =3÷15 = 0.2 2 II 2 =2÷15 = 0.133 3 I 1 =1÷15 = 0.0667 4 III 3 =3÷15 = 0.2 5 IIII 5 =5÷15 = 0.333 6 I 1 =1÷15 = 0.0667 IIIIIIIIIIII 15 1.0
As relative frequency experiment trials get closer to infinity…
Sample Space Tree Diagram… 1 2 3 P 4 5 6
Sample Space S = {…} Example: a bag of skittles… S = {yellow, orange, green, purple, yellow} n(s) = 5
Simple Probability # of favourable outcomes P(event) = # of total outcomes How does this compare to the relative frequency formula???
Example… 2 1 P(1,2) = = 6 3
Conclusion… We can use relative frequency tables for experimental probability, but using simple probability is more accurate and efficient.