Models for Market Valuation
90 likes | 268 Views
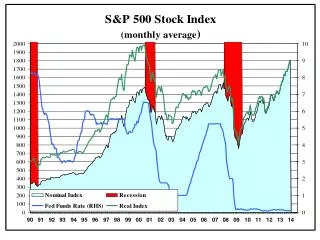
Models for Market Valuation. Jan 8, 2011. Leigh Anderson leigh@houstoninvestors.com Presentation at www.tayara.com/hia. Models. Robert Shiller John Hussman Fed Model CXO Advisory Bonus: Timing with Bollinger Bands. Robert Shiller. P/E10 = price / avg 10 years earnings.

Models for Market Valuation
E N D
Presentation Transcript
Models for Market Valuation Jan 8, 2011 Leigh Anderson leigh@houstoninvestors.com Presentation at www.tayara.com/hia
Models • Robert Shiller • John Hussman • Fed Model • CXO Advisory • Bonus: Timing with Bollinger Bands Houston Investors Association /Evidence-Based Investing SIG / Leigh Anderson
Robert Shiller P/E10 = price / avg 10 years earnings Houston Investors Association /Evidence-Based Investing SIG / Leigh Anderson http://www.econ.yale.edu/~shiller/data/ie_data.xls
Applying Shiller P/E10 a strategy at the end of January 1921 of buying (selling) the S&P Composite Index when P/E10 crosses below (above) its 40-year lagged average not obvious that the P/E10 threshold strategy can earn a large enough return on cash while out of stocks to materially best a buy-and-hold benchmark P/E10 has some predictive power for long-term future returns, but this predictive power does not convincingly translate into an outperforming investment strategy. Houston Investors Association /Evidence-Based Investing SIG / Leigh Anderson http://www.cxoadvisory.com/fundamental-valuation/pe10-and-future-stock-returns/
John Hussman • The key elements: ‘valuations’ and ‘market action.’ • approach is to “align our investment position with the prevailing Market Climate and shift that position when sufficient evidence of a Climate shift emerges.” Evidence … does not convincingly support a belief that John Hussman successfully times the stock market via hedging adjustments based on his assessments of market valuation and market action. Houston Investors Association /Evidence-Based Investing SIG / Leigh Anderson http://www.cxoadvisory.com/individual-gurus/john-hussman/
The “Fed Model” • Compare forecast Earnings Yield (E/P) to T-Bill rate • Hold (sell) if E/P greater (less than) T-Bill • evidence … does not support a belief that the Fed Model usefully predicts stock market returns over the past two decades. Houston Investors Association /Evidence-Based Investing SIG / Leigh Anderson http://www.cxoadvisory.com/fed-model/testing-the-fed-model/
CXO Advisory “Real Earnings Yield” • Akin to the Fed Model • Substitutes forecasted inflation rate for T-Bill rate • REY = E (forecast) / P – Inflation (forecast) • Investors require the expected (12-month forward) stock market earnings yield to exceed the expected (12-month forward) inflation rate as evidence that equities have the potential to generate a positive real return. • Note: earnings and inflation forecasts obtained from simple trend-following mechanical rule Houston Investors Association /Evidence-Based Investing SIG / Leigh Anderson http://www.cxoadvisory.com/real-earnings-yield-rey-model-details/
REY • REY Model appears to offer some information about S&P 500 Index returns over the next few quarters Houston Investors Association /Evidence-Based Investing SIG / Leigh Anderson
Timing with Bolinger Bands • can an investor beat a buy-and-hold strategy by buying (selling) when the market crosses below (above) the lower (upper) Bollinger Band? • evidence from simple tests over the past 17.5 years does not support a belief that investors (especially those with small accounts) can beat a buy-and-hold strategy by using Bollinger Bands to buy low and sell high for the broad U.S. stock market. Houston Investors Association /Evidence-Based Investing SIG / Leigh Anderson