Download
1 / 8
90 likes | 540 Views
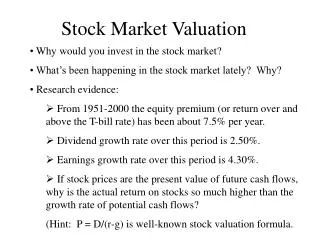
Stock Market Valuation . Why would you invest in the stock market? What’s been happening in the stock market lately? Why? Research evidence: From 1951-2000 the equity premium (or return over and above the T-bill rate) has been about 7.5% per year.

E N D
Stock Market Valuation • Why would you invest in the stock market? • What’s been happening in the stock market lately? Why? • Research evidence: • From 1951-2000 the equity premium (or return over and above the T-bill rate) has been about 7.5% per year. • Dividend growth rate over this period is 2.50%. • Earnings growth rate over this period is 4.30%. • If stock prices are the present value of future cash flows, why is the actual return on stocks so much higher than the growth rate of potential cash flows? (Hint: P = D/(r-g) is well-known stock valuation formula.
Stock Valuation Models • P = E(EPS) x P/E ratio, where E(EPS) is expected future EPS. • P = D/(r-g) • Capital Asset Pricing Model (CAPM) by Sharpe, Lintner, Mossin • R(jt) = RF(t) + B[RM(t) – RF(t)] + e(jt) • where B is beta, R(jt) is the return on stock j at time t, RM is the market return (e.g., S&P500 index), RF is the risk-free rate (e.g., the T-bill rate), and e is an error term with mean zero. • According to research evidence by Fama and French (1992, 1993, 1996), the CAPM does not work! B is zero!
CAPM fails! say Fama and French x x R(jt) x x Should get B > O x x RF x x x x x x B = 0 x RM(t) – RF(t)
Stock Valuation Models • Fama French propose new 3-factor modelR(jt) = RF(t) + B1[RM(t) – RF(t)] + B2[Size Factor] + • B3[Value Factor] + e(jt), • where Size Factor = returns on small firms minus large firms • Value Factor = returns on value firms minus growth firms • This model explains more than 90% of variation in stock returns. • Some people are now adding a Momentum Factor (= returns on firms whose stocks are increasing over time minus firms whose stocks are decreasing over time.
Stock Valuation Models • Arbitrage Pricing Theory (APT) • R(jt) = RF(t) + B1[RM(t) – RF(t)] + B2[GDP] + B3[Employment] + B4[Inflation] …. + e(jt) • where other factors are so-called “state variables” that describe the overall macroeconomy. • Advantage – very general model that includes economic conditions that surely affect stock market returns. • Disadvantage – not clear which factors to use exactly.
Stock Valuation Models • Behavorial school – they argue that financial markets are not always efficient. That is, at times prices do not reflect all available information accurately and rapidly. • Information uncertainty causes slow market responses to information that leads to price continuation • Irrational investors cause prices to move in ways not expected by rational investors. Slow market response, or price continuation Stock Price Arrival of good news to the market Time
Investment Strategies • Active strategies • Technical analysis – examine charts of stock prices to find trends in them over time. Buy and sell stocks based on trends. (Problem: Stock prices are a random walk according to weak form tests of market efficiency.) • Fundamental analysis – examine the accounting statements, financial position, and industry and economic conditions to buy and sell stocks. (Problem: Stock prices cannot be predicted based on available public information according to semi-strong tests of market efficiency.)
Investment Strategies • Passive strategies • Diversification – reduce risk by spreading investments in financial instruments that are not perfectly correlated with one another. • Dollar-cost averaging – invest regularly in the stock market so that you buy at some average price and earn the long-run average rate of return on stocks. • Portfolio rebalancing – fix some target percentages for your diversified portfolio (e.g., 60% stocks and 40% bonds) and once a year buy and sell to realign this percentages. In this way you sell assets that increase in value and buy assets that have decreased in value.