RELIABILITY
250 likes | 398 Views
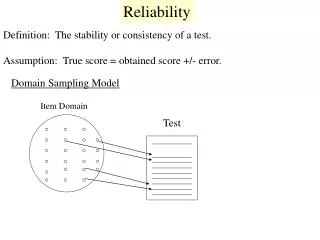
RELIABILITY. Marky Kidd Probability and Statistics Presentation EMIS 7370. Reliability. “ The probability that a system or product will perform in a satisfactory manner, without failures, for a given period of time when used under specified operating conditions. ” Conditional probability

RELIABILITY
E N D
Presentation Transcript
RELIABILITY Marky Kidd Probability and Statistics Presentation EMIS 7370
Reliability “The probability that a system or product will perform in a satisfactory manner, without failures, for a given period of time when used under specified operating conditions.” • Conditional probability • Performance standard • Confidence level • Stress levels • Mission time • Age
Founding Father- Robert Lusser 1899-1969 German Engineer and Aircraft designer 1941Robert Lusser, German V-1 rocket scientist, recognizes need 1953 Formalized his reliability views Which became the Lusser Law
Lusser Law • The reliability of a series system is equal to the product • of the reliability of its component subsystems, if their • failure modes are known to be statistically independent. • Rs = R1 x R2 x . . . x Rn • Since a single path exists, the failure of any element in the system interrupts the path and causes the system to fail
History of Reliability 1941Robert Lusser, German V-1 rocket scientist, recognizes need 1943 Joint Army-Navy vacuum tube development committee 1950DoD establishes ad hoc group on Reliability 1953RCA establishes1st organized Reliability program discipline 1955IEEE initiated the Reliability and Quality Control Society 19561st Reliability text book is published 1957Air Force issues 1st reliability specification 1960US Naval Post Graduate school offers Reliability course 19621st annual R&M conference held 1965Founding of the Society of Reliability Engineers (SRE)
Determine Reliability • In order to determine the reliability of a system: • Broken down into structure trees: • System/End Item • WRA/U – Weapons Repairable Assembly/Unit • SRA/SRU – Shop Repairable Assembly/Unit • ORU – Orbital Repair Unit (Space hardware) • Repair Part • Non-repair part / piece part
Reliability Engineering • The function of analyzing the expected or actual reliability • of a product, process or service, and identifying actions • to reduce failures or mitigate their effect. Engineers • analyzing reliability typically carry out reliability • predictions, design testing, monitor and analyze field • failures, along with suggesting design and manufacturing • changes.
4 Major Concepts of Reliability • 1. Reliability is the probability that a system • Will demonstrate specified performance • for a stated period of time • 4. When operated under specified conditions
Probability Reliability Major Concepts Given Time Reliability Stated Conditions Performance
Reliability Goals • To reduce repairs • To lower cost • Uphold and maintain the company’s reputation MONEY!!!!
Reliability Function • The reliability function or the survival function is determined from the probability that a product will not fail for a specified amount of time t. No Failures
Reliability Equations • Reliability Function • Density Function f(t), • Failure Rate per Hour
The Bathtub Curve Continued… • Infant mortality: Decreasing Failure Rate • Higher number of failures due to product variations, manufacturing processes etc. • Useful Life: Low “Constant” Failure Rate • Leveling off due to debugging • Wear-Out Period: Increasing Failure Rate • Failure rate increase due to product age/duration
Measures of Reliability • 1.0 (100% Reliable) • to • 0.0 (non-Reliable) e = 2.718281828 (not repeating)
Reliability vs. Non-Reliability • Rn= Reliability Qn= Un-Reliability 1- Qn= Reliability (Success) 1- Rn= Non-Reliability (Failure)
Distributions • Binomial, Exponential, Normal, Poisson, and Weibull are • all different distributions that can be use to determine • failures in systems/products
Weibull Distribution • 1937 Developed by the Swedish professor Dr. Waloddi • Weibull • 1951 Introduced to the public in Dr. Waloddi’s paper “A • Statistical Distribution Function of Wide Applicability,”
Purpose of Weibull Distribution • Model failure characteristics such as: • strength test • infant mortality • random failures • wear-out, • failure-free periods • failure rate predictions • determining cost effectiveness and maintenance periods of reliability-centered maintenance activities.
Weibull continued.. • 2 Parameters: • Shape parameter: Beta(β) (the slope) • The shape parameter is the slope of the function; therefore, different values of the shape parameter can change the way the distribution and reliability of a population may look. • Scale parameter: eta (h) (sometimes n or k) • scale parameter will determine when in time a product or population of products will fail; 63.2% the characteristic life.
Weibull Distribution and Reliability • Weibull distribution can be used to compute the percentiles of the reliability function or rather the • products that didn’t fail (survived) along with the confidence limits for these estimates.
Weibull Distribution continued… • Weibull Distribution changes reliability depending on the • value of the shape parameter: • For β<1, the reliability decreases early in the product’s • life and then slowly from there on. • For β>1, initially the reliability plot shows a small drop, • but sharply at some later point in time.
Summary • Weibull most flexible distribution for determining reliability • Figuring out Expected number of failures is essential • Implementing a Reliability Program is vital to the success of a product/system • Customer satisfaction • Identify risk • Decrease ownership of product Performance over time