Download
1 / 50
651 likes | 1.02k Views
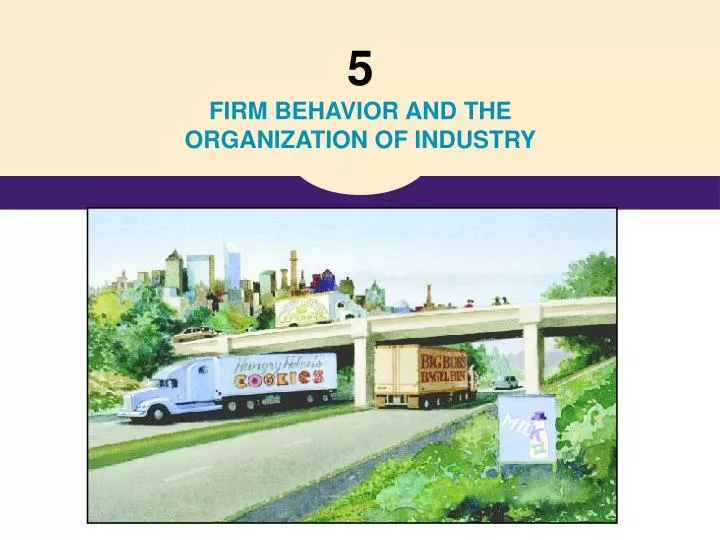
5 FIRM BEHAVIOR AND THE ORGANIZATION OF INDUSTRY. Competition . In this part of the course, we will look at how the functioning of an economy depends on the degree to which businesses can exert control over the prices they set

E N D
5 FIRM BEHAVIOR AND THE ORGANIZATION OF INDUSTRY
Competition • In this part of the course, we will look at how the functioning of an economy depends on the degree to which businesses can exert control over the prices they set • How much freedom a firm has to set prices depends on the intensity of the competition it faces from other firms • This is why the analysis of prices depends on the intensity of competition CHAPTER 13 THE COSTS OF PRODUCTION
13 The Costs of Production
A Firm’s Costs • In Chapter 4 we saw the theory of supply and demand, which assumes perfect competition • In Chapter 7 we saw that Chapter 4’s supply curve is constructed from data on production costs • Recall the example of the house painters Mary, Frieda, Georgia and Grandma • In this chapter, we take a closer look at costs CHAPTER 13 THE COSTS OF PRODUCTION
A Firm’s Costs • Another reason to study costs is that the intensity of competition between firms can depend on the relationship between a firm’s costs and its level of production • In crude terms, if firms’ unit costs tend to be lower when production levels are higher, existing mega-firms are likely to crush any competition from firms that are new and small CHAPTER 13 THE COSTS OF PRODUCTION
Profit, the firm’s objective • The economic goal of a firm is to maximize its profit. Profit = Total revenue - Total cost
Total Revenue, Total Cost, and Profit • Total Revenue • The money a firm receives from the sale of its output. • TR = P Q • We saw this is chapter 5 • Total Cost • The market value of all the inputs (resources) a firm uses in production.
Explicit and Implicit Costs • A firm’s cost of production include explicit costs and implicit costs. • Explicit costs are costs that require a direct outlay of money by the firm’s owner(s). • Implicit costs are costs that do not require an outlay of money by the firm • If some of the resources used in production are provided by the owner(s) of the firm, the firm may not have to pay for them. • The market value of such resources is the implicit cost. • Implicit costs are included in total cost.
Implicit Costs: Examples • You own a restaurant and you work eighteen hours a day in it • You could have worked elsewhere and earned a wage. This lost income is an implicit cost • You have invested $20,000 of your own savings in your restaurant • You could have earned interest had you put that money in a bank instead. This lost interest income is an implicit cost CHAPTER 13 THE COSTS OF PRODUCTION
Economic Profit versus Accounting Profit • Economic profit = total revenue – total cost = total revenue – (explicit costs + implicit costs) • Accounting profit = total revenue – explicit costs • As a result, accounting profit > economic profit
Economic profit Accounting profit Implicit costs Revenue Revenue Total opportunity costs Explicit Explicit costs costs Figure 1 Economic versus Accountants How an Economist How an Accountant Views a Firm Views a Firm
Economic Profit and Firm Sustainability • Non-negative economic profit is essential for the long-run viability of a firm • Caroline’s Cookie Factory • total revenue = $700 per hour • total explicit costs = $650 per hour • for labor and raw materials • total implicit costs = $110 per hour • in wages Helen could have earned as a computer programmer • Accounting profit = $50 per hour. • This indicates short-run financial viability • Economic profit = – $60 per hour. • This indicates a dire long-run future. • Dissatisfied with the $50 per hour profit, Helen will eventually shut down the firm and take a programming job CHAPTER 13 THE COSTS OF PRODUCTION
PRODUCTION FUNCTION • The production function shows the relationship between quantity of inputs used to make a good and the quantity of output of that good.
Marginal Product • The marginal product of any input in the production process is the increase in output that arises from one additional unit of that input. Note that the marginal product diminishes as more of the resource is used. This is a common assumption in economics.
Diminishing Returns in Production • Diminishing marginal product is the property whereby the marginal product of an input decreases as the quantity of the input increases. • Example: As more and more workers are hired at a firm, each additional worker contributes less and less to production because the firm has a limited amount of equipment that all workers must share.
Figure 2 Caroline’s Production Function Quantity of Output (cookies per hour) Production function 150 140 130 120 Note that this production function graph shows diminishing marginal product. 110 100 90 80 70 60 50 40 30 20 10 Number of Workers Hired 0 1 2 3 4 5
Table 1 A Production Function and Total Cost: Caroline’s Cookie Factory Fixed Cost Variable Cost Turning these two columns into a graph yields the cost curve. See next slide.
Figure 2 Caroline’s production function and total-cost curve Quantity of Output (cookies per hour) Total Cost Production function (a) Production function (b) Total-cost curve Total-cost curve $90 30 20 10 40 50 60 70 80 100 160 140 120 40 20 80 60 160 140 100 120 20 40 80 60 1 2 3 4 5 6 Number of Workers Hired Quantity of Output (cookies per hour) 0 0
THE VARIOUS MEASURES OF COST • Total Cost consists of fixed costs and variable costs. • Fixed costs are those costs that do not vary with the quantity produced. • Variable costs are those costs that varywith the quantity produced. • TC = FC + VC
The various measures of cost: Conrad’s Coffee Shop Check that TC = FC + VC
Figure 3 Conrad’s Coffee Shop Total-Cost Curve Total Cost Total-cost curve $15.00 14.00 13.00 12.00 11.00 10.00 9.00 8.00 7.00 6.00 5.00 4.00 3.00 2.00 1.00 Quantity 0 1 2 3 4 5 6 7 8 9 10 of Output (cups of coffee per hour)
Average Fixed and Variable Costs • We know that TC = FC + VC • Therefore, TC/Q = FC/Q + VC/Q • Therefore, ATC = AFC + AVC
The various measures of cost: Conrad’s coffee shop Check that ATC = TC/Q, AFC = FC/Q, and AVC = VC/Q Check that ATC = AFC + AVC
Figure 4 Conrad’s Coffee Shop Average-Cost and Marginal-Cost Curves Costs AFC = FC/QAs FC is constant, FC/Q decreases as Q increases. Therefore, AFC decreases as Q increases $3.50 3.25 3.00 2.75 2.50 2.25 2.00 1.75 1.50 1.25 1.00 0.75 0.50 AFC 0.25 Quantity 0 1 2 3 4 5 6 7 8 9 10 of Output (cups of coffee per hour)
Figure 4 Conrad’s Coffee Shop Average-Cost and Marginal-Cost Curves Costs • AFC decreases as Q increases, • AVC increases as Q increases, because of diminishing returns. • As ATC = AFC + AVC, ATC is U-shaped; as Q increases, it decreases initially and then begins to increase. $3.50 3.25 3.00 2.75 2.50 2.25 2.00 1.75 ATC 1.50 1.25 AVC 1.00 0.75 0.50 AFC 0.25 Quantity 0 1 2 3 4 5 6 7 8 9 10 of Output (cups of coffee per hour)
Figure 4 Conrad’s Coffee Shop Average-Cost and Marginal-Cost Curves The quantity at which ATC is lowest is called the efficient scale output. Costs $3.50 3.25 3.00 2.75 2.50 2.25 2.00 1.75 ATC 1.50 • For Conrad’s Coffee Shop, the efficient scale is 5 or 6 cups of coffee per hour 1.25 1.00 0.75 0.50 0.25 Quantity 0 1 2 3 4 5 6 7 8 9 10 of Output (cups of coffee per hour)
The various measures of cost: Conrad’s coffee shop Check that MC = TC/ Q = VC / Q
Figure 4 Conrad’s Coffee Shop Average-Cost and Marginal-Cost Curves Marginal cost rises with the amount of output produced. This reflects the assumption of diminishing marginal product Costs $3.50 3.25 3.00 2.75 2.50 2.25 MC 2.00 1.75 1.50 1.25 1.00 0.75 0.50 0.25 Quantity 0 1 2 3 4 5 6 7 8 9 10 of Output (cups of coffee per hour)
Figure 4 Conrad’s Coffee Shop Average-Cost and Marginal-Cost Curves Costs $3.50 3.25 3.00 2.75 2.50 2.25 MC 2.00 1.75 ATC 1.50 1.25 AVC 1.00 0.75 0.50 AFC 0.25 Quantity 0 1 2 3 4 5 6 7 8 9 10 of Output (cups of coffee per hour)
Cost Curves and Their Shapes • Relationship Between Marginal Cost and Average Total Cost • Whenever marginal cost is less than average total cost, average total cost must be decreasing. • Whenever marginal cost is greater than average total cost, average total cost must be increasing.
Cost Curves and Their Shapes • Relationship Between Marginal Cost and Average Total Cost • The marginal-cost curve crosses the average-total-cost curve at the efficient scale. • Efficient scale is the quantity that minimizes average total cost.
Figure 4 Conrad’s Coffee Shop Average-Cost and Marginal-Cost Curves Costs $3.50 3.25 3.00 2.75 2.50 2.25 MC 2.00 1.75 ATC 1.50 1.25 1.00 0.75 0.50 0.25 Quantity 0 1 2 3 4 5 6 7 8 9 10 of Output (cups of coffee per hour)
Typical cost curves are assumed to be slightly different from the ones we have just seen Typical Cost Curves
Figure 5 Cost Curves of a Typical Firm (a) Total-Cost Curve Total Cost TC $18.00 16.00 14.00 12.00 10.00 8.00 6.00 4.00 2.00 2 4 6 8 10 12 14 0 Quantity of Output
Figure 5 Cost Curves of a Typical Firm (b) Marginal- and Average-Cost Curves Costs $3.00 2.50 MC 2.00 1.50 ATC AVC 1.00 0.50 AFC 0 2 4 6 8 10 12 14 Quantity of Output
Typical Cost Curves • Three Important Properties of Cost Curves • Marginal cost eventually rises with the quantity of output. • The average-total-cost curve is U-shaped. • The marginal-cost curve crosses the average-total-cost curve at the minimum of average total cost.
COSTS IN THE SHORT RUN AND IN THE LONG RUN • For many firms, the division of total costs between fixed and variable costs depends on the time horizon being considered. • In the short run, some costs are fixed. • In the long run, fixed costs become variable costs.
COSTS IN THE SHORT RUN AND IN THE LONG RUN • Because some costs are fixed in the short run and variable in the long run, a firm’s long-run cost curves differ from its short-run cost curves.
ATC in short ATC in short ATC in short run with run with run with small factory medium factory large factory ATC in long run Figure 6 Average Total Cost in the Short and Long Run Average Total Cost $12,000 Quantity of 0 1,200 Cars per Day
Economies and Diseconomies of Scale • Economies of scale refer to the property whereby long-run average total cost falls as the quantity of output increases. • Diseconomies of scale refer to the property whereby long-run average total cost rises as the quantity of output increases. • Constant returns to scale refers to the property whereby long-run average total cost stays the same as the quantity of output increases
ATC in short ATC in short ATC in short run with run with run with ATC in long run small factory medium factory large factory $12,000 10,000 Constant Economies returns to of Diseconomies scale scale of scale 1,000 1,200 Figure 6 Average Total Cost in the Short and Long Run Average Total Cost Quantity of 0 Cars per Day
Summary • The goal of firms is to maximize profit, which equals total revenue minus total cost. • When analyzing a firm’s behavior, it is important to include all the opportunity costs of production. • Some opportunity costs are explicit while other opportunity costs are implicit.
Summary • A firm’s costs reflect its production process. • A typical firm’s production function gets flatter as the quantity of input increases, displaying the property of diminishing marginal product. • A firm’s total costs are divided between fixed and variable costs. Fixed costs do not change when the firm alters the quantity of output produced; variable costs do change as the firm alters quantity of output produced.
Summary • Average total cost is total cost divided by the quantity of output. • Marginal cost is the amount by which total cost would rise if output were increased by one unit. • The marginal cost always rises with the quantity of output. • Average cost first falls as output increases and then rises.
Summary • The average-total-cost curve is U-shaped. • The marginal-cost curve always crosses the average-total-cost curve at the minimum of ATC. • A firm’s costs often depend on the time horizon being considered. • In particular, many costs are fixed in the short run but variable in the long run.