Download
1 / 33
360 likes | 435 Views
Delve into the historical significance and modern applications of Raman effect in this comprehensive overview of surface-enhanced micro-CARS mapping of organic molecules. Understand key milestones, scientific advancements, and cutting-edge techniques. Discover the intricate nature of Raman scattering and its impact on molecular spectroscopy. Learn about Coherent Anti-Stokes Raman Scattering (CARS), Surface-Enhanced Raman Scattering (SERS), and Tip-Enhanced Raman Scattering (TERS). Explore the physical background and innovative approaches in CARS microscopy. This article provides a deep dive into the multifaceted world of Raman spectroscopy and its role in current scientific research.

E N D
90 years of Raman effect: surface-enhanced micro-CARS mapping of organic molecules GrigoryArzumanyan FLNP, Sector of Raman spectroscopy 48th meeting of the PAC for Condensed Matter Physics 14 – 15 June 2018
OUTLINE Foreword 90-years of Raman effect: history in brief and key milestones 3. Current results on surface-enhanced coherent antistokesraman scattering (SECARS). 4. Summary 2 2
Science is united “You can not draw a line between large and small, as both are equally important for a single whole” Niels Bohr Discovery of the Raman effect– 1928, Nobel prize, 1930 Discovery of the neutron by James Chadwick – 1932, Nobel prize, 1935
90 YEARS of RAMAN EFFECT C.V. Raman G.S. Landsberg A. Smekal L.I. Mandelstam Discovered by C.V. Raman and K.S. Krishnan (student of C.V. Raman) in liquids (Calcutta, 28 Feb., 1928), and independently by G.S. Landsbergand L.I. Mandelstam in crystals (Moscow, MSU, 21 Feb., 1928) The effect was predicted theoretically by Adolf Smekalin 1923 C.V. Raman – Nobel Prize in Physics, 1930 4
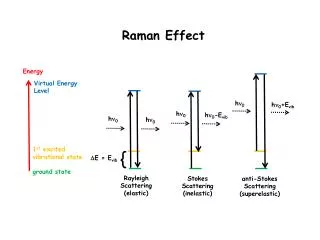
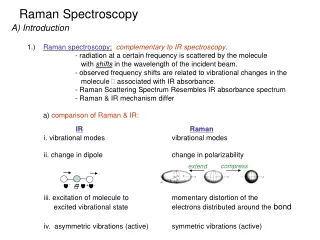
Scattering of light by molecules Raman is based on the inelastic scattering of incident radiation on molecular vibrations/rotations Diagram of the Rayleigh and Raman Scattering Processes
Historical photos of discovery (1928) Raman - Krishnan Landsberg - Mandelstam incident light scattering spectrum, quarts seal (rhinestone) scattering spectrum, benzene
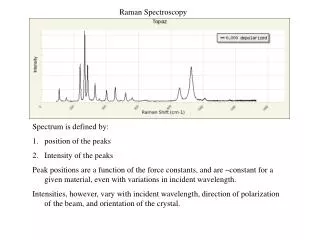
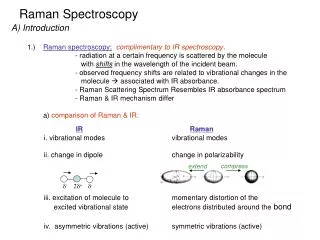
The main specificity distinguishing Raman/IR spectroscopy from other spectroscopic methods – both of them are molecular vibrational spectroscopy Although the spectral features of Raman and infrared spectra can be interpreted in a similar way the selection rules are different. • Infrared absorption is sensitive to the change of the dipole moment µ during the vibration. • A Raman active vibration is sensitive to the change of polarizability during the vibration. Raman scattering is also known as a “fingerprint spectroscopy” 7
Classical Raman Physics Polarizability induced dipole equation Scattering at the combination frequencies (Raman effect) 8
Raman signal is very informative – vibrational frequencies are characteristic of chemical bonds (chemical structure) in a specific molecule: normal modes Raman scattering is weak: 1 in 106incident photons are Raman scattered 9
90-years of Raman effect: key milestones 1961– invention of lasers,a new generation of light excitation sources – Nobel Prize in Physics (1964), A.M. Basov, A.M. Prokhorov, C.H. Townes 1966 –CARS:Coherent Anti-Stokes Raman Scattering, first recordings by P. D. Maker and R. W. Terhune, Ford Motor company 1974 –SERS:Surface-Enhanced Raman Scattering, first demonstration by M. Fleischmann – a technique which provides many orders of magnitude increases in Raman intensity 1985 – TERS (or nano-Raman): Tip-Enhanced Raman Scattering - the concept was first proposed by Wessel in 1985, and was experimentally realized in 2000 (nanoscale resolution imaging) From the 80s to the present: improvement of the optics, filters (especially notch filters) , detectors (PMT, CCD), soft, etc. • Modern trends: • combination of CARS with SERS – SECARS • Shell-Isolated NP Enhanced Raman Spectroscopy – SHINERS 10
SECARS Surface Enhanced micro-CARS from GoldNanoparticle-Immobilized Organic Moleculesat a Nanostructured CeO2/Al Film 11
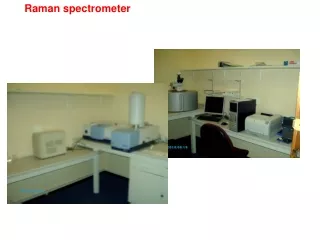
Multimodal optical platform at JINR Raman SERS F-CARS, E-CARS, P-CARS SECARS Transmitted and reflected channels “CARS” microscope Up-conversion luminescence SHG, SONICC Second harmonic & sum frequency generation 12
Physical background of CARS CARS is a third-order nonlinear process that involves a pump beam at a frequency ωp and a Stokes beam at a frequency of ωs. The signal at the anti-Stokes frequency of ωas= 2ωp- ωsis generated in the phase-matching direction. ωvib=ωpump-ωStokes The sample is stimulated through a four-wave mixing parametric process. ICARS(ω)~ |CARS(3)|2xIp2IS x N2 (3) – third-order nonlinear susceptibility The vibrational contrast in CARS is created when the pump-Stokes frequency difference matches molecular vibration of a particular chemical bond = ωvib and the oscillations of molecules with that bond are driven coherently. Thus, CARS provides a chemically specific signature of various molecules.
The CARS process in details CARS microscopy is a coherent imaging method in which the induced polarization assumes a well-defined phase relation with the excitation fields. CARS energy diagram Non-resonant component arises from the electronic contributions to (3) : a) off-resonance transitions, b) two-photon non-resonant contribution. ICARS(ω)~ |CARS(3)|2xIp2IS x N2 (3) – third-order nonlinear susceptibility c a d b ωAS= 2ωp- ωSt
Оptical layout of SECARS experiments Nikon TE2000S SECARS H7844, Hamamatsu Fast mapping Fast mapping Slow mapping HS 101H, PROSCAN, Belarus Slow mapping SECARS SECARS 15
Analyte/reporter molecules Al/CeO2/AuNP/DTNB 1900 nm-thick film Dithionitrobenzoic acid (DTNB) Al/CeO2/AuNP/mPBA1900 nm-thick film mercaptoPhenylBoronic acid(mPBA) 16
SERS-active substrates*: Al/CeO2/AuNP 0.5 mm thick 29×29 μm Microphotography SEM images of a CeO2/Al/Al2O3 sample surface with the TNB-modified Au‐NPs: (a) ~7.5 µm × 4.5 µm, (b) ~0.6 µm× 0.4 µm *[1] I. Kurochkin, I. Ryzhikov, A. Lagarkov,et al//Advanced Electromagnetics 2014, 3, 57 [2] I. N. Kurochkin, I. A. Ryzhikov, A. N. Lagarkov, et al//MSU Chem. Bull. 2015, 70, 102 17
Preliminary toSECARS test-control measurements 18
SERS spectra from: Al/CeO2/Au/DTNB иAl/CeO2/Au/MPBA 633 nm laser excitation SERS (DTNB) SERS (MPBA) SERS spectrum of DTNB is dominated by the strong peaks at 1338cm−1and 1555cm-1assigned as the symmetric stretch of the nitro group s(NO2) and the aromatic ring stretch, respectively. SERS spectrum of MPBA is dominated by the strong bands at 1073cm-1and 1585cm-1assigned to the in-plane bending and stretching modes CCC+CS and CC, respectively. 19
Comparison of the spatial distribution of DTNB 1338 см-1and 1555 см-1lines intensities, and 450 см-1CeO2Excitation: 532 nm Camera 450 cm-1 SERS substrate CeO2 1338 cm-1 1555cm-1 DTNB DTNB Scan area: 23х18 µm 20
Definition of optical damage threshold of the sample Safe operation: IL<200-300 kW/cm2 (or 2-3mW/µm2) ~ 6x10¹⁵ photons/µm2/s 450 cm-1 1338 cm-1 21
Spatial distribution of epi-CARS (epi-TCFWM)signal for unmodified Au-NPs on CeO2 film surface λp = 900 nm (1714 cm-1) Nonresonance λp = 932 nm (1338 cm-1) TNB resonance line (λaS = 828 nm) (λaS = 780 nm) CARS laser powers: Pp ≈ 30 µW иPS ≈ 52 µW 40 µm × 40 µm, 51 х 51 pixels, slow mapping with step~ 0.8 µm The numbers in the look-up tables (LUT) correspond to ADC counts SECARS imaging contrast of signal-generating Au-NP structures lies in the range of 250-700, normalized by the product P2p× PS are ~0.15–0.87 counts/µW3(relation~ 6). 23 23
Highly-contrastSECARSresonant micro-imageof a sample surface area modified with TNB/Au-NPs conjugates 1338cm-1 Scan area: 24 х 24 µm, resolution: 251 х 251 pl λp = 932 nm(≈300 µW),λS = 1,064 nm (≈1,000 µW), λaS = 828nm fast-mapping, step 0.1µm, 1s/image Background signal ~ 45 counts Contrast of theSECARSimage of TNB/Au-NPs ~400 24
SECARS resonant image of a sample surface areamodified by CeO2/Al/Al2O3/Au-NP/mPBA 1571 сm-1 19.3×19.3 µm, 20×20 pl λp= 912 nm (≈900 µW),λS = 1064 nm(≈1200 µW) λaS ≈ 798 nm Slow scan with a step of 1.0 µm, 1s/pl Background signal ~ 25 counts Imaging contrast is ~50, Normalized by the productP2p × PS is ~1.3·10-6 counts/µW3 25
Comparison/correlationofSECARS и SERSsignals distribution fromCeO2/Au-NP/mPBA SECARS, 1571 сm-1 SERS, 1571 сm-1 Scan area 29×29 µm, slow mapping with a step of 1 µm, 1s/pl SERS:785nm, 1 mW, 1571 сm-1 - 4·1015 photons/µ2/s, (λS = 895nm) CARS:λp = 912 nm (1571cm-1), 0.3mW(λp)+1.2 мВт (λS) – totally~ 8·1015photons/µ2/s Imaging contrasts ~50 (SECARS) и 7 (SERS) 26
Comparison/correlationofSECARS и SERSsignals distribution fromCeO2/Au-NP/mPBA in 3D performance SERS SECARS 27
Resonant and nonresonant SECARS micro-images of TNB/Au-NPson CeO2 film surface Resonance λp = 932nm (1338 cm-1) Nonresonance λp = 900 nm (1714 cm-1) Pp ≈ 30 µW PS ≈ 52 µW 40× 40 µm 51 х 51 pl Nonresonance Counts ~ 160 Backgr. ~ 5 Contrast~ 30 (Norm. 3.6х10-3) Resonance Counts ~ 6000 Backgr. ~ 25 Contrast~ 240 (Norm. 0.13) resonance/nonresonance ratio: ≈ 35 with TNB modified molecules ≈6 withoutTNB 28
SUMMARY • The very first experiments on SECARS mapping have been done in Russia, FLNP, JINR. • Nonlinear CARS microscopy is an efficient and fast technique for imaging with much stronger signal and chemical contrast without using tags. • The excellent chemical imaging contrast and ultrasensitive detectability of the reporter molecules can be achieved by SECARS. Results are published in JRS (IF ~ 3.0) G. Arzumanyan, K. Mamtkulov, V. Fabelinsky, V. Smirnov, et al// JRS, 2018, 1-10, https://doi.org/10.1002/jrs.5333 and recently presented (G. Arzumanyan) at the jubilee conference dedicated to the 90-years of the Raman effect in Novosibirsk, 27 May – 01 June 2018 29
Thank You! 30
Tip Enhanced Raman Scattering (TERS) or nano-Raman – brings Raman spectroscopy into nanoscale resolution imaging TERS combines the chemical sensitivity of surface-enhanced Raman spectroscopy (SERS) with high spatial resolution of scanning probe microscopy (SPM) and enables chemical imaging of surfaces at the nanometer length-scale. TERS imaging is performed with an AFM-Raman spectrometer, a SPM integrated with an optical micro-spectrometer. TERS image of single wall carbon nanotubeswith spatial resolution of ~ 30 nm TERS signals are not strong enough because there is only one tip working as a signal amplifier. 32
SHINERS– a new generation of Raman technique Shell-Isolated Nanoparticle Enhanced Raman Spectroscopy • Au or Ag NPs are employed with a layer of ultrathin inert silica shell. • Each Au core-inert shell nanoparticle can be considered as a TERS tip. • Under a laser spot, the shell-isolated nanoparticles monolayer is equal to thousands of tips, thus the obtained Raman signal is very strong. • The ultrathin shell is used to avoid the direct contact of molecules with Au or Ag NPs, thus the obtained signal is just from the interested species adsorbed on the substrate. 33