Evaluation of Subbase Compaction Characteristics
260 likes | 474 Views
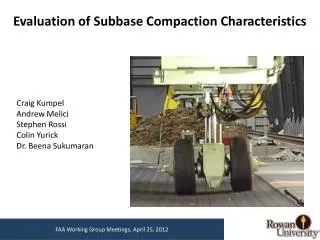
Evaluation of Subbase Compaction Characteristics. Craig Kumpel Andrew Melici Stephen Rossi Colin Yurick Dr. Beena Sukumaran. Outline. Background and Objectives P-154 Test Results P-209 Test Results DGA Test Results Correlation of lab results with field data Conclusions.

Evaluation of Subbase Compaction Characteristics
E N D
Presentation Transcript
Evaluation of Subbase Compaction Characteristics Craig Kumpel Andrew Melici Stephen Rossi Colin Yurick Dr. Beena Sukumaran FAA Working Group Meetings, April 25, 2012
Outline • Background and Objectives • P-154 Test Results • P-209 Test Results • DGA Test Results • Correlation of lab results with field data • Conclusions FAA Working Group Meetings, April 25, 2012
Background • Continuous loading from airplane landing gear creates ruts in pavement • Bigger and heavier planes with complex gear configurations make rut prevention more difficult • FAA believes rutting at the National Airport Pavement Test Facility (NAPTF) for the chosen pavement configurations subjected to heavy aircraft loads is caused by densification of subbase FAA Working Group Meetings, April 25, 2012
NAPTF – Rutting Behavior North wheel track of CC3 flexible pavements at 19,500 passes Garg and Hayhoe (2006) FAA Working Group Meetings, April 25, 2012
CC5 Trench Cross Section FAA Working Group Meetings, April 25, 2012
Objectives • Determine the correlation between trafficking passes of various aircrafts/construction equipment and number of gyrations in the SGC • Determine the change in the performance metrics (includes shape and angularity of particles, as well as gradation) of the unbound aggregate when it is subjected to trafficking/gyrations in the SGC • Determine the mechanism that is causing compaction of the unbound aggregate during trafficking FAA Working Group Meetings, April 25, 2012
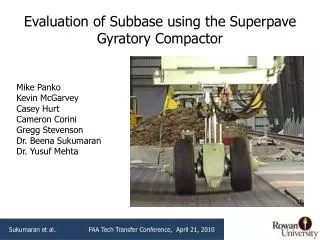
Gyratory Compactor and Soil Parameters • Angle Used: 1.25° • Pressure Used: 600, 800 and • 1000 kPa • # of Gyrations: 800 • Sample Size: 3000 grams • Water Content Ranges:2-2.5%, 2.5-3%, 3-3.5%, 3.5-4%, • 4-5%, 5-6% FAA Working Group Meetings, April 25, 2012
P-154 FAA Working Group Meetings, April 25, 2012
P-209 FAA Working Group Meetings, April 25, 2012
DGA FAA Working Group Meetings, April 25, 2012
SGC vs. Proctor Tests • Energy input from Proctor tests come from impact hammer (all vertical work) • The SGC can achieve higher densities than the impact hammer alone • The energy input from the SGC comes from: • Vertical load applied • Shearing caused by the gyratory movement • Energy input more efficient at achieving similar densities FAA Working Group Meetings, April 25, 2012
MDD Placement in P-154 FAA Working Group Meetings, April 25, 2012
P-154 Comparison of Field and SGC Compaction FAA Working Group Meetings, April 25, 2012
MDD Placement in DGA FAA Working Group Meetings, April 25, 2012
DGA Comparison of Field and SGC Compaction FAA Working Group Meetings, April 25, 2012
P-154 Grain Size Distribution Analysis FAA Working Group Meetings, April 25, 2012
P-209 Grain Size Distribution Analysis FAA Working Group Meetings, April 25, 2012
DGA Grain Size Distribution Analysis FAA Working Group Meetings, April 25, 2012
Mechanism of Compaction Different modes of grain breakage: a) fracture, b) attrition and c) abrasion. (Ramamurthy et al., 1974) FAA Working Group Meetings, April 25, 2012
P-154 Construction to SGC Correlation FAA Working Group Meetings, April 25, 2012
Field To Lab Correlation • 800 kpa was used based on past results showing its • similarity to field measurements FAA Working Group Meetings, April 25, 2012
Conclusions • SGC is capable of replicating field compaction results • Capable of achieving much higher densities than the Modified Proctor test • SGC density results follow the same trend of the Modified Proctor test • SGC reaching construction densities at relatively low gyration counts • Compaction mechanism for trafficking is attrition and abrasion • Reduces angularity and therefore interlock • SGC follows same mechanism of compaction as trafficking • SGC was able to produce a similar amount of aggregate crushing in comparison to trafficked material • Done by compacting to final maximum densities provided by the FAA FAA Working Group Meetings, April 25, 2012
Acknowledgments • The work described in this presentation was supported by the FAA Airport Technology Research and Development Branch, AJP-6310, Dr. Satish K. Agrawal, Manager, under Grant #11-G-008. The contents of the presentation reflect the views of the authors, who are responsible for the facts and accuracy of the data presented within. The contents do not necessarily reflect the official views and policies of the FAA. The presentation does not constitute a standard, specification, or regulation. FAA Working Group Meetings, April 25, 2012