Download
1 / 23
230 likes | 367 Views
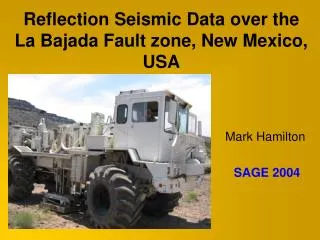
An E-W gravity profile across the La Bajada fault Zone in the Rio Grande Rift, North Central New Mexico. Rajesh Goteti University of Rochester SAGE 2007. Outline. Introduction Gravity Survey Data Analysis and Interpretation Conclusions. Introduction. Profile Line. La Bajada

E N D
An E-W gravity profile across the La Bajada fault Zone in the Rio Grande Rift, North Central New Mexico Rajesh Goteti University of Rochester SAGE 2007
Outline • Introduction • Gravity Survey • Data Analysis and Interpretation • Conclusions
Introduction Profile Line La Bajada Fault Zone
Equipment Lacoste Romberg analog gravity meter Scintrex digital gravity meter
DataReduction • Tidal and Drift Correction • Latitude Correction • Free-air Correction • Bouguer correction • Terrain Correction
Gravity Method Flowchart Drift & Tidal Corrections Inner Zone Terrain Correction Complete Bouguer Anomaly Contouring the Anomaly
Complete Bouguer Anomaly Map on the geologic map ∆ρ = 0.47 g/cc C. I. = 1 mGal La Bajada Fault Zone • Steep gradient across the anomaly contours coincides with the location of mapped fault zone trace 24 km 0
Complete Bouguer Anomaly Map C. I. = 1 m. Gal ∆ρ = 0.47 gm/cc Possible Location of the La Bajada Fault Zone +Gravity Stations High Low
LBF LBF SFF TF High Low Differences Between CBA and RBA SFF
Regional Aeromagnetic Survey Map High nT Low Gravity Profile Line • Steep gradient supports the possibility for a fault zone
Geological Map showing the location of the profile in the gravity survey Profile Line La Bajada Fault Zone
Residual Gravity Anomaly Profile RA (mGal) Easting (m)
So what do we have so far ? • Complete and Residual Bouguer Anomalies maps to help identify the La Bajada fault surface trace • Aeromagnetic map which predicts a fault trace that agrees with the fault trace above • Residual Gravity anomaly profile for the line of interest • Model Density contrast of 0.47 gm/cc
In addition • Transocean Oil Company seismic lines to (1) constrainthe depth to ‘basement’ in both the footwall and hanging wall of the La Bajada fault and (2) throw on both the fault segments • Velocity estimates from Baldridge et al (1994) N Transocean Seismic Line 79-1 SP 70 Transocean Seismic Line 78-7 SP 90 12 km
ModelDerived Observed Misfit 79/1 Sp 70 78/7 Sp 90 TO lines ρ = 2.2 gm/cc 3.6 Km 1.4 Km “Basement” ρ = 2.67 gm/cc 0.5X 2-D Forward Model using GM-SYS (km)
Non- uniqueness ModelDerived Observed Misfit 79/1 Sp 70 78/7 Sp 90 TO lines ρ = 2.2 gm/cc 3.8 Km 1.4 Km “Basement” ρ = 2.67 gm/cc 0.5X ρ = 2.4 gm/cc “Basement” ρ = 2.67 gm/cc
Conclusions ModelDerived Observed Misfit 79/1 Sp 70 78/7 Sp 90 ρ = 2.2 gm/cc 3.6 Km 1.4 Km “Basement” ρ = 2.67 gm/cc 0.5X
Conclusions (contd..) • Gravity surveys can be used to locate faults (e.g. La Bajada Fault) and estimate approximate depths of layers based on density contrast. • Gravity surveying is a relatively inexpensive, fast technique for a first order insight into the subsurface geology. • Subsurface models based on gravity cannot yield unique solutions. Other geophysical techniques (e.g., seismics) can complement and constrain the gravity model better.
Acknowledgements • Shawn, George, Darcy • Scott for the wonderful field trips • Team members • SAGE faculty/staff for giving this enriching • experience
1D Forward Model Depth(m) App Rho(ohm m) 102 101 101 102 100 Phase 103 90o 45o 0o 10-4 10-3 10-2 100 101 102 Rho(ohm m) Period(s)
1D Occam Inversion, 8 layers forward model Station 1 Station 3 Station 2 100 100 100 101 101 101 (m) (m) (m) 102 102 102 103 103 103 104 104 104 101 102 101 102 101 102
Gravity modeling can be used to locate faults and other geophysical techniques can be used to constrain a gravity model and generate a reasonable subsurface geological interpretation • Seismic reflection shows no evidence of Tanos fault. Creating a synthetic seismogram for Hawley’s geological cross-section may hint about the signatures of Tanos fault • The shallow depths along the survey line modeled with refraction seismics does not reveal any faults Thanks!!!!