Download

1 / 16
160 likes | 331 Views
Modelling the expected distribution of new HIV infections by exposure group. Purpose. To understand the sources of new HIV infections and the importance of each To use this information for program planning. Methods. The spreadsheet uses the current prevalence of HIV infection

E N D
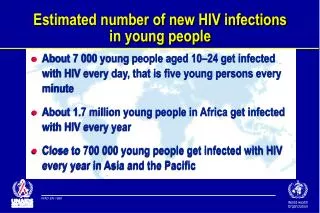
Modelling the expected distribution of new HIV infections by exposure group
Purpose • To understand the sources of new HIV infections and the importance of each • To use this information for program planning
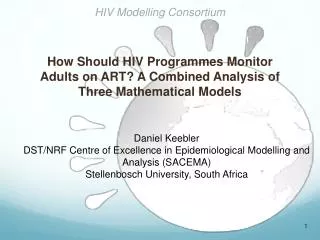
Methods The spreadsheet uses • the current prevalence of HIV infection • numbers of individuals with particular exposures, and • the rates of these exposures to calculate the expected incidence of HIV infection over the coming year
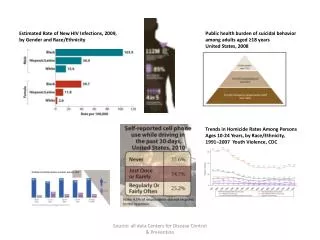
Major modes of transmission of HIV in adults • Sexual contact • Commercial sex • Casual sex • Marital sex • Men who have sex with men • Injecting drug use • Blood transfusions • Medical injections
New infections from sexual transmission • New infections = f(HIV prevalence in partners, number of partners, acts per partner, transmission probability per act, STI co-factors, condom use) • Protection = condom use
S = p = B = β = α = ν = n = Probability of HIV Transmission (sexual) I = S [ 1- { pB[1-β´ ]α(1-ν) + p(1-B)[1-β]α(1-ν) + (1-p) }n ] Number susceptible HIV prevalence in partners prevalence of STIs in partners probability of transmission (with STI (β´), without STI (β) ) contacts per partner proportion acts protected by condom use number of partners
p = β = α = ν = n = Probability of HIV Transmission (IDU) I = S [ 1- { p [1-β ]α(1-ν) + (1-p) }n ] HIV prevalence in needle sharing partners probability of transmission contacts per partner use of sterile needles number of partners
New infections from unsafe medical injections • New infections = Population * [1 – (1 – Ps * Pt * Pc)n] Ps = Prevalence (total population) Pt = Transmission probability Pc = prevalence * % unsafe needles n = number of injections per year • Protection = % unused or sterile needles
New infections from blood transfusions • New infections = number of unscreened units transfused * HIV prevalence * (1 – HIV prevalence) • Protection = percent of units screened
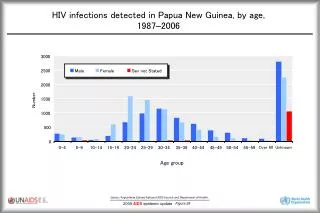
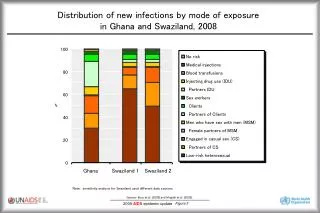
Distribution of infections Injecting Drug Use (IDU) Partners IDU Sex workers Clients Partners of Clients MSM Female partners of MSM Casual heterosexual sex Partners CHS Low-risk heterosexual sex No risk Medical injections Blood transfusions
Blood transfusions Medical injections No risk Low-risk heterosexual sex Partners CHS Casual heterosexual sex Risk group Female partners of MSM MSM Partners of Clients Clients Sex workers Partners IDU Injecting Drug Use (IDU) 0 5 10 15 20 25 30 35 Percent