Cognitive Neuroscience
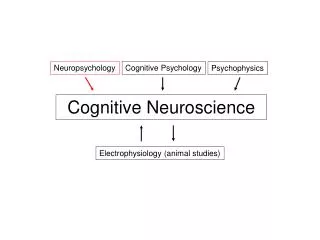
This comprehensive overview explores various methodologies in cognitive neuroscience for assessing brain activity, including both non-invasive and invasive techniques. Non-invasive methods like PET, fMRI, ERP, and MEG provide insights into blood flow and electrical activity. Invasive methods, such as single unit and cortical recording, offer precise spatial and temporal resolution. Historical context is provided through early observations of neural activity by physiologists like Angelo Mosso and John Fulton. Key questions regarding brain localization and cognitive functions are addressed, shedding light on the interplay between neural activity, blood flow, and cognition.


Cognitive Neuroscience
E N D
Presentation Transcript
Cognitive Neuroscience Methods for Investigating the Living Brain
CNS methods Recording brain activity • PET (positron emission tomography) • fMRI (functional magnetic resonance imaging) • ERP (event related potentials) • MEG (magneto-encephalography) • Single unit recording • Cortical recording
Recording methods Non-invasive, measure blood flow, +spatial resolution: • PET (positron emission tomography) • fMRI (functional magnetic resonance imaging) Non-invasive, measure electrical activity, + temporal resolution: • ERP (event related potentials) • MEG (magneto-encephalography) Invasive, measure electrical activity, +temporal and spatial resolution • Single unit recording • Cortical recording
Questions to be addressed • Questions about the brain -localization of known cognitive function -determining the function of a specific area or structure (2) Questions about cognition -brain location can be used as a marker to investigate some cognitive question (e.g., Does visual imagery make use of the machinery of vision?)
Neural activity and blood flow Angelo Mosso (19th century): Italian physiologist • Working with an individual who had suffered a head injury that left him with a defect of the skull so that part of the brain was not covered with skull • Observed pulsations • Pulsations increased when the ringing of the church bells signaled 12 o’clock noon (the time of required prayer) • Mosso observed an increase in pulsation rate when the subject was asked questions, asked to perform simple calculations • These changes occurred independently of changes in heart rate or blood pressure measured in the arm
Neural activity and blood flow Dr. John Fulton (1928) • 26-year old Walter K. with severe headaches and failing vision -> surgery to remove AVM over visual cortex (congenitally abnormal blood vessels) failed and left a defect in the skull overlying visual cortex • Patient commented on a noise in the back of his head that increased in intensity when he used his eyes • The sound could be recorded through a stethoscope • It increased when Walter went from rest in a dark room to using his eyes in difficult viewing circumstances • Pulsation rate was not affected by using other senses (smelling tobacco or vanilla)
PET 1- injection of water labeled with positron-emitting radioactive isotope (oxygen 15); half life is a little over 2 minutes, eliminate in 10 minutes 2-radioactive water travels with blood and serves as a maker of neural metabolism 3- positrons emerge from the nucleus because its neutron deficiency makes it unstable -a positron travels a few mm, is attracted to an electron, the two are annihilated, creating two photons that leave the site in exactly opposite directions, exiting the head at the speedof light 4- radiation detectors organized as coincidence circuits detect the simultaneous collisions 5-special algorithms compute the location of the annihilation event
MRI & fMRI • When protons are exposed to a steady magnetic field, they align their spin axes in the field direction
MRI/fMRI (2) The alignment can be perturbed by a brief pulse of radio waves that tip the axes away from their parallel orientation with the external magnetic field (3) When the pulse is turned off the protons return to their original orientation and in so doing release energy in the form of radio waves Different types of atoms produce different frequencies In effect, the resonating particles become transmitters with characteristic frequencies • The greater the number of protons of a given molecule type, the larger the signal Static/structural MRI (structural scan): measures the differences in water density in brain tissue to see brain structures (like CT)
fMRI How do we measure changing brain events? • Paramagentic agents in the brain produce local magnetic fields that disrupt the realignment of the proton spin axes -> reduction in the signal in the area around the paramagnetic agent • Deoxygenated hemoglobin acts as a paramagentic agent, emitting a smaller signal than areas with oxygenated hemoglobin
As neural activity increases, blood flow increases, and the ration of oxygenated/deoxygenated hemoglobin increases (4) We can track neural activity by tracking changes in amounts of oxygenated/deoxygenated hemoglobin (5) Amount of signal at each voxel of the brain measured at each time point
Sample Experimental Conditions Goal: identify areas of the brain sensitive to visual motion Conditions: 40 sec repeating epochs of: 1- blank screen 2-randomly positioned white dots on a black background, moving 3-randomly positioned white dots on a black background, stationary Why include condition 1?
Data Analysis: PET and fMRI 1-Individual subjects brain images are warped to conform to a standard atlas (typically Talairach) -> everybody’s brain is the “same” 2-For each voxel, signal strength is determined for the different experimental conditions 3-the values are statistically compared across experimental conditions 4- these values are averaged across subjects
Data analysis (cont) Output of the analysis: • NOT pictures! • Numerical values (statistical significance) for each voxel • Numerical values are typically superimposed on a structural image (different value ranges are assigned different colors)
Measuring the electrical activity of the brain: EEG, ERP and MEG EEG (electroencephalography): continuous recording of general brain activity (not tied to specific events) ERP (event related potentials): extraction from the overall EEG of the small signals that are related to processing of specific stimulus events MEG (magnetoencephalography): like ERP except measuring the magnetic fields generated by neural activity
Electrical fields: created by the synchronous activity of the dendrites of pyramidal cells oriented perpendicular to the cortical surface (gyri) Pyramidal cells: approx. 70% of neocortical neurons (more than 100,000 per sq mm)
ERP Goal: extraction from the overall EEG of the small signals that are related to processing of specific stimulus events Problem: the signals are very small, the noise is great Solution: average signals across many, many trials (the noise will cancel itself out, leaving the signal) Measurement: Voltage relative to a reference electrode
This is an ERP waveform comparing the brain's response to a task relevant tone (TRG) compared to an irrelevant tone (STD)
These are 64 channels of ERP Looking down on the head with the top of the head at the center, the nose at the top of the figure, the back of the head at the bottom, and the ears at the sides
From the multi-channel recordings we can create interpolated topographic maps of the scalp field at any given time. By measuring the locations of the recording electrodes on the head with a magnetic digitizer, we can orient the interpolated field on a 3 dimensional head model to create a 3D topographic map of the scalp electrical field 2D topographic map of the P300 scalp electrical field The topographic map has the same orientation as the waveform plot with the top of the head at center, nose at the top, and ears at the sides. 3D topographic map of the P300 scalp electrical field
The source localization problem in ERP Goal: use distribution of scalp responses to discover the source/s of the electrical activity Problem: electrical currents distorted because: -secondary currents are generated, -brain and skull distort the signal -inverse problem
MEG Similar to ERP in attempting to extract small signals that are related to processing of specific stimulus events, except that MEG measure the magnetic fields generated by the electric currents Magnetic fields are generated perpendicular to the electrical fields Only pyramidal cells oriented parallel to the skull surface will produce magnetic fields that extend extracranially MEG measure the location of outgoing and ingoing magnetic currents
MEG Problem: the fields are very weak (10-12 tesla) relative to the magnetic fields generated by the earth, traffic, equipment, heart (“a challenging problem akin to listening for the footsteps of an ant in the middle of a rock concert”) Advantage over ERP: magnetic fields are not distorted by the tissue they pass through, localization of the dipoles is somewhat easier
Measuring MEG • Magnetically shielded room (mu metal and aluminum) • Magnetometers: measure brain’s magnetic fields (inductin coils), “transfer” info to the SQUID • SQUID (Superconducting Quantum Interference Device—in liquid helium to induce superconductivity): Detects small changes in current, amplifies • Gradiometers: cancel out distant magnetic signals (in fixed location)
Figure 4. (a) Typical MEG signals. Each box shows the magnetic field strength recorded in a single channel over a 512 millisecond epoch. The stimulus in this example was a moving pattern, designed to activate an area of the brain implicated in movement perception. The latency of peak magnetic field is 190 milliseconds after stimulus presentation, and the peak field was around 400fT.(b) Contour map of the magnetic field at 190ms for a movement stimulus. The map shows the magnetic field, constructed over the bottom of the dewar. Red/Orange denotes positive field (i.e. field out of the head), blue/purple denotes negative field. The dipolar nature of the map is consistent with the generating current source being a single current dipole
Current dipole fits for 190ms after a movement stimulus, superimposed on MRI representations. The dipole is a red/white square box.
Single-cell recording • Measure the firing rate of a single cell by inserting an electrode either inside a cell (intracellular) or just outside (extracellular) • Determine which experimental manipulations produce a consistent change in the baseline response rate of the cell
CNS methods Recording brain activity • PET (positron emission tomography) • fMRI (functional magnetic resonance imaging) • ERP (event related potentials) • MEG (magneto-encephalography) • Single unit recording • Cortical recording