Download

1 / 34
380 likes | 710 Views
What Does your “I” See: Ischemia, Injury or Infarction?. Carol Fahje MS, RN, BC Nursing Education Specialist Emergency Department Mayo Clinic, Rochester, MN . Objectives. Review normal electrical flow through the heart.

E N D
What Does your “I” See: Ischemia, Injury or Infarction? Carol Fahje MS, RN, BC Nursing Education Specialist Emergency Department Mayo Clinic, Rochester, MN
Objectives • Review normal electrical flow through the heart. • Discuss normal coronary artery anatomy and associated leads reflecting ischemic changes. • Identify ECG indications of ischemia, injury and infarction. • Analyze case studies.
Conduction System • Sinoatrial Node (SA node, sinus node) • Normal pacemaker of heart, because it possesses the fastest inherent rate of automaticity • Initiates a rhythmic impulse at a rate of 60-100 • Located in right atrium near superior vena cava
Intra-atrial pathways • Conducts impulse from SA node through atrial musculature to atrioventricular (AV) node • Consists of: • Anterior tract (Bachmann’s): through left atrium • Middle tract (Wenckebach’s): through right atrium • Posterior tract (Thorel’s): through right atrium • Located in atrial tissue between SA and AV nodes
AV Node • Delays impulse from atria before it moves to ventricles • Allows for ventricular filling • Serves as a protective mechanism against rapid supraventricular impulses • Located in the floor of right atrium, close to the tricuspid valve • Junctional Tissue • Serves as back-up pacemaker • Intrinsic rate 40-60 • General term to describe the tissue in the lower AV node but above the bifurcation of bundle of HIS
Bundle of HIS/Right and Left Bundle Branches • Arises from AV node and conducts impulses to the ventricles via the bundle branches • Intrinsic rate less than 40 • Purkinje System • Conducts impulses from the distal portion of bundle branches to the sub-endocardiallayers of the ventricles • Located distal to the bundle branches • The terminal conduction system
Coronary ArteriesBlood supply to myocardium itself achieved by three major coronary arteries • Location • Originate in aortic arch just underneath flap of aortic valve • Openings are very small • Fill only during diastole
Coronary Blood Supply Left main coronary artery Right coronary artery (RCA) Left Circumflex (Left Circ) Left anterior descending (LAD)
Three Main Coronary Arteries • Right Coronary Artery • Supplies AV node and inferior wall of myocardium in 90% of population • Supplies SA node in 55% of population • Left Main has two major branches • Left Anterior Descending (LAD) • Supplies all of bundle branches • Anterior wall of LV, part of RV • Anterior 2/3 of interventricular septum • Left Circumflex • Supplies lateral wall of LV • AV node in 10% of population • SA node in 45% of population
12 Lead Reference: Leads Reflecting Heart Walls aVR I V4 V1 aVL V2 V5 II V6 aVF V3 III • Infarction • Pathological Q waves • Posterior MI • Tall R waves in V1, V2 and/or V3 along with ST Depression • ISCHEMIA • ST Depression • T Wave Inversion • Flattened T waves • Hyperacute T waves • Injury • ST Elevation • Hyperacute T waves
ST Segment and T Wave Changes • After ventricular depolarization, normal myocardial cells are at nearly the same action potential. This is reflected during the ST Segment
Ischemia: Myocardial demand exceeds supply • Two characteristic changes seen: 1. ST Depression 2. T Wave Inversion • T-waves should be upright in all leads EXCEPT: • aVR • V1 (50% of the population are inverted….)
Hyperacute T-Waves • Sign of significant ischemia and a precursor to acute injury • Must be at least 7 mm high • HOWEVER, may indicate other conditions (e.g. hyperkalemia if widespread across the 12 lead)
Injury: ST Elevation • Occurs in the setting of abrupt loss of blood flow to the myocardium
ST Elevation • Usually stays elevated for 1-2 days but should return to baseline within two weeks • Must be elevated greater than 1 mm in at least 2 contiguous leads • Again…seen in leads immediately looking at the are of injury
Reciprocal Changes • ST depression found in electrically opposite leads showing ST Elevation (e.g. inferior wall ST elevation (II, III, avF) reciprocates with ST depression in lateral wall leads (I and avL) • Speculation that STEMIs presenting with reciprocal changes have a larger myocardial area at risk (Journal of Cardiovascular Magnetic Resonance, 2013)
aVR: The Forgotten Lead • ST elevation >1 mm indicates: • LAD/Left main coronary artery (LMCA) occlusion or severe 3 vessel disease • Predicts the need for bypass surgery • Differentiates LMCA from proximal LAD occlusion if ST elevation in aVR is > than ST elevation in V1 • Absence of ST elevation in aVR almost entirely excludes significant LMCA http://www.apiindia.org/medicine_update_2013/chap22.pdf
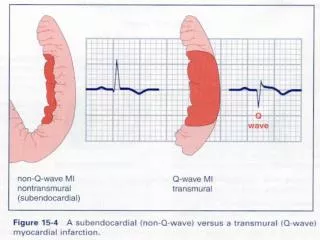
Infarction • Pathological Q waves are the classic indication of myocardial necrosis • Reflect the fact that electricity must travel great distances around the necrosed tissue • Appear several hours or days after the MI • Criteria: • Must be > 0.04 seconds wide • Should be greater than 25% the height of any accompanying R wave
Pathological Q-Wave in Lead II Normal Pathological Q Wave
Pathological Q waves • Inferior Leads affected • Note presence of ST elevation as well indicating this is recent
References • http://lifeinthefastlane.com/ecg-library/lmca/ • http://lifeinthefastlane.com/ecg-library/myocardial-ischaemia/ • http://www.uptodate.com/contents/electrocardiogram-in-the-diagnosis-of-myocardial-ischemia-and-infarction • http://www.apiindia.org/medicine_update_2013/chap22.pdf • Journal of Cardiovascular Magnetic Resonance 2013, 15(Suppl 1):P172 doi:10.1186/1532-429X-15-S1-P172 • Mayo Clinic Advanced ECG Workshop class content.