Understanding Correlation Coefficients: Interpretation and Application in SPSS
Learn how to correctly interpret and apply Pearson correlation coefficients in SPSS for data analysis. Understand the direction, strength, and implications of correlation results.

Understanding Correlation Coefficients: Interpretation and Application in SPSS
E N D
Presentation Transcript
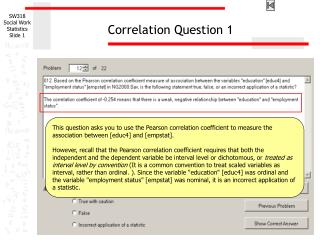
Correlation Question 1 This question asks you to use the Pearson correlation coefficient to measure the association between [educ4] and [empstat]. However, recall that the Pearson correlation coefficient requires that both the independent and the dependent variable be interval level or dichotomous, or treated as interval level by convention (It is a common convention to treat scaled variables as interval, rather than ordinal. ). Since the variable "education" [educ4] was ordinal and the variable "employment status" [empstat] was nominal, it is an incorrect application of a statistic.
Correlation Question 2 This question asks two things: Whether the correlation coefficient is correct?; and, if yes, whether the interpretation of the relationship is correct?
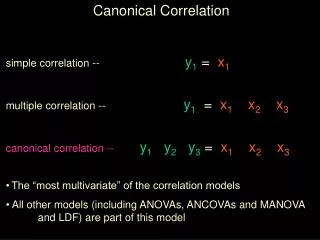
Correlation in SPSS (1) In SPSS, you can obtain a correlation coefficient between two variables by clicking: Analyze > Correlate > Bivariate…
Correlation in SPSS (2) First, select and move the two variables of interest, [age] and [nperinhh], into the “Variables:” box. Then, make sure the “Pearson” in the “Correlation Coefficients” section was selected and click OK.
Correlation Output in SPSS You can find the correlation coefficient for the two variables in the cell defined by “Respondent’s age” [age] and “Nbr of people in HH” [nperinhh]. The correct correlation coefficient is -.121. Using the interpretive guide for measures of association (0.0 = no relationship, +/-0.0 to +/-0.2 = very weak, +/-0.2 to +/-0.4 = weak, +/-0.4 to +/-0.6 = moderate, +/-0.6 to +/-0.8 = strong, +/-0.8 to +/-1.0 = very strong, +/-1.0 = perfect relationship), a correlation coefficient of -0.121 would be interpreted as a very weak relationship. Since the sign of r is a minus sign, it is a very weak, negative relationship. The answer to the question is true.
Correlation Question 3 The question about direction and strength of the relationship can also be stated without including the numeric value. This question asks about the direction of the relationship: it states that as the age variable increases in value, the number of persons in the household decreases. The first part of this question will be true if Pearson’s r has a negative value. The second part of the question will be true if the correct adjective has been selected for the value of Pearson’s r.
Correlation Output in SPSS In the output for the previous question, we found that the value for r was -.121, so the statement that there is a negative relationship (as scores on one variable increase, scores on the other variable decrease). In addition, the r of -.121 fit in the category described as very weak, so the statement about the strength of the relationship is also true. The answer to the question is true.
Correlation Question 4 We can use the output for correlations to answer a question about the Proportional Reduction in Error interpretation for this relationship.
Correlation Output in SPSS Recall that the measure of association is related with the PRE (Proportional Reduction of Error) and correlation is a kind of the measure of association. However, in order to interpret the correlation coefficient as a measure of PRE, you have to square the correlation coefficient first. In other words, the PRE between these variables is r2. (i.e., -.1212=.015) Thus, we can say that information about survey respondents scores on "age" improves our predictions of their "number of people in the household" by 1.5%. The answer to the question is true.
Correlation Question 5 The word problem about the direction of the relationship is a little more complicated when one or both of the variables are ordinal level because we have to take into account the coding of the variable in the value labels. The Pearson r correlation coefficient measures the pattern for the numeric values. We need to incorporate the value labels into the interpretation.
Correlation Output in SPSS The computed value of the correlation coefficient with "education" [educ4] as the independent variable and "agreement that respondent has something valuable to give to the world" [valatt07] as the dependent variable was 0.169. The plus sign for the correlation coefficient means that higher numeric values for "education" [educ4] are associated with higher numeric values for "agreement that respondent has something valuable to give to the world" [valatt07].
Correlation Output in SPSS If we look at the value labels for education, we see that higher numeric values are associated with having completed more years of school.
Correlation Output in SPSS If we look at the value labels for having something to give to the world [valatt07], we see that higher numeric values are associated with agreement with the statement.
Correlation Output in SPSS The statement of the relationship: “survey respondents who had completed more years of school agreed that they had something valuable to give to the world” is correct. However, the statement that the relationship is weak is incorrect, since a correlation coefficient of .169 would be characterized as very weak. The answer to the question is false.
Regression Question 1 This question asks about interpretation of the regression equation between [educ4] and [nperinhh]. First we check the level of measurement of each variables. Since both independent and dependent variables are either interval level or ordinal level but can be treated as interval by convention, using regression equation is legitimate. Let’s take a look at how to get regression equation in SPSS in the following.
Regression in SPSS (1) In order to get a regression equation between two or more variables in SPSS, click: Analyze > Regression > Linear…
Regression in SPSS (2) Recalling that the [nperinhh] was “predicted” by [educ4] in the practice problem, [nperinhh] is determined to be the dependent variable and [educ4] the independent variable. Click “OK” to get the output.
Regression Output in SPSS In the SPSS output, we have to look at the last table labeled as “Coefficients” to create the regression equation between the dependent and independent variables. The intercept is found in the column titled 'Unstandardized Coefficients - B,' in the row titled '(Constant),’ which equals 3.623 and the slope is in the row titled 'EDUC4 Education’ of the same column, which equals -0.322. Thus the regression equation can be written as: [nperinhh]=3.623-0.322*[educ4]
Regression Output in SPSS However, this interpretation should be done with caution because the independent variable in this analysis, "education", is an ordinal level variable. It is a common convention to treat scaled variables as interval, rather than ordinal. We will follow this convention and permit the use of scaled, ordinal variables in a statistical analysis expecting interval level data. This will not be treated as an incorrect application of a statistic, but rather we will add a caution to any true findings, since not all data analysts agree with the convention. The answer is true with caution. In the regression equation, [nperinhh]=3.623-0.322*[educ4], the intercept in the equation can be interpreted as following: “If the value for "education" were zero, the predicted value for "number of people in the household" would be 3.623.” The intercept is correctly interpreted in the question.
Regression question 2 This question is also based on the regression equation, but instead of asking about the intercept, it is asking about the slope. We use the same SPSS output used for the last question.
Regression Output in SPSS In the regression equation, [nperinhh]=3.623-0.322*[educ4], the slope in the equation can be interpreted as following: “If the value of "education" increased by 1, the predicted value of "number of people in the household" would change by -.322.” The interpretation of the slope in the question is correct. However, this interpretation should be done with caution because the independent variable in this analysis, "education", is an ordinal level variable. It is a common convention to treat scaled variables as interval, rather than ordinal. We will follow this convention and permit the use of scaled, ordinal variables in a statistical analysis expecting interval level data. This will not be treated as an incorrect application of a statistic, but rather we will add a caution to any true findings, since not all data analysts agree with the convention. The answer to the question is true with caution.
No No No Yes Yes Correlation question 1 Question: value, strength, and direction of Pearson’s r correlation coefficient? Both independent and dependent variable interval or ordinal level? Inappropriate application of a statistic Yes Value of Pearson’s r stated correctly, strength described by correct adjective, and direction stated correctly? False Independent or dependent variable ordinal level? True True with caution
No No No Yes Yes Correlation question 2 Question: description of direction and strength of Pearson’s r correlation coefficient? Both independent and dependent variable interval or ordinal level? Inappropriate application of a statistic Yes Description of direction accurate for numeric value and strength described by correct adjective? False Independent or dependent variable ordinal level? True True with caution
No No No Yes Yes Correlation question 3 Question: PRE interpretation of improvement in predictive accuracy? Both independent and dependent variable interval or ordinal level? Inappropriate application of a statistic Yes Numeric percentage for reduction in error is correct value for coefficient of determination, r2? False Independent or dependent variable ordinal level? True True with caution
No No No Yes Yes Regression equation question 1 Question: predicted value of dependent variable when independent variable is zero? Both independent and dependent variable interval or ordinal level? Inappropriate application of a statistic Yes Predicted value of dependent variable matches the intercept in the regression equation? False Independent or dependent variable ordinal level? True True with caution
No No No Yes Yes Regression equation question 2 Question: change in predicted value of dependent variable when independent variable increases by one? Both independent and dependent variable interval or ordinal level? Inappropriate application of a statistic Yes Predicted change in dependent variable matches the slope in the regression equation? False Independent or dependent variable ordinal level? True True with caution