Download
1 / 27
270 likes | 567 Views
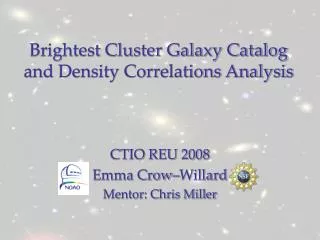
CTIO REU 2008 Emma Crow–Willard Mentor: Chris Miller. Brightest Cluster Galaxy Catalog and Density Correlations Analysis. Brightest Cluster Galaxies (BCGs). Generally: Brightest Most Massive Center of Luminosity Peak of Cluster Bottom of Gravitational Potential Well of Cluster

E N D
CTIO REU 2008 Emma Crow–Willard Mentor: Chris Miller Brightest Cluster Galaxy Catalog and Density Correlations Analysis
Brightest Cluster Galaxies (BCGs) Generally: • Brightest • Most Massive • Center of Luminosity Peak of Cluster • Bottom of Gravitational Potential Well of Cluster • High Velocity Dispersions (stars in galaxy) • Close to X-Ray Peak Emission • Likely to Host Radio Active Galactic Nuclei • High Dark Matter Mass
Importance of BCGs • Understanding galaxy formation (mass growth) • Hierarchical cosmology?: • Galaxies are accreted to make the BCG over time • Infall along cluster filaments • Stars in these systems begin forming very early and in different entities • Monolithic collapse?: • Galaxies form early and quickly in a gravitational collapse of gaseous cloud • Understanding their unique stellar populations • Reddest galaxies (Dry Mergers?Passive evolution?No evolution?) • BCG origin related to host cluster collapse and formation • Distance indicators • Narrow photometric and color distributions
Z = 0.039490420 Z = 0.030805720 Z = 0.041672383 Z = 0.044332169 Z = 0.068908095 Z =0.13486274 A look-back through time
BCG Catalog Data Source • Original C4 Cluster Catalog • 1714 Clusters, z = 0.02 – 0.17 • Sloan Digital Sky Survey (SDSS) DR5 • One BCG guess per Cluster • Central Luminosity Peak R.A. and Dec. • Cluster Galaxy Members’ R.A. and Dec. • Cluster Redshift (z)
Catalogued BCGs • Brightest galaxy in the cluster by 0.1 mag • Within 500 kpc of the cluster luminosity central peak • Confirmed by eye
New BCG Catalog Continents • Revised list of 818 BCGs • BCG R.A. and Dec. • C4 Cluster ID number • Host cluster redshift • Absolute u, g, r, i, z, J, H, K magnitudes • Absolute NUV magnitudes • NUV-J and u-r colors • Radio luminosities • X-ray luminosities • Matches to Lauer-Postman BCG catalog
BCG Density Correlations Analysis • IR major axis • Radio wave major axis • Radio wave position angle • U optical absolute magnitude • G optical absolute magnitude • R optical absolute magnitude • I optical absolute magnitude • Z optical absolute magnitude • J infrared absolute magnitude • H infrared absolute magnitude • K infrared absolute magnitude • NUV-J color • Redshift (z) • U-R color • Optical ellipticity • Optical position angle • X-ray counts • X-ray hardness ratios • X-ray extinction • Near Ultraviolet (NUV) absolute magnitudes • NUV ellipticity • NUV theta image • NUV theta world • Infrared (IR) integrated flux • IR position angle
Density Correlations Statisticsdensity = 0.0006-0.0009, z = 0.06-0.1
Conclusions Mild correlation in the u-r color and significant correlation in the NUV-J color both show reddening in more dense BCG systems • Possible explanations: • In higher density areas there is more dust which causes a reddening effect • Denser BCG systems have older stellar population
Conclusions • Mild correlation in near UV of dimming magnitude in higher density environments • Possibly incorrect magnitude calculations in denser environments • Older stellar population • Relatively significant correlation in J,H,K of brightening in higher density systems • Assumption is luminosity = mass, therefore the more luminous they get, the more massive they get, that is, the more they accrete over time. The structure must have formed earlier- supports hierarchical model
BCG Density Correlations Analysis Results Denser = More Massive (J) = Redder = Older
Future Studies • Absolute magnitude limit on SkyQuery galaxy search in SDSS to eliminate redshift-density selection effect correlation • Focus on density extremes of BCGs to try and draw conclusions on older stellar populations and formation times • Look at stellar ages and metallicities through spectra to determine age • Stellar Population Synthesis models
Acknowledgments • Thanks to • Chris Miller for his original catalog, time, patience, scientific knowledge, debugging abilities, and overall great mentorship skills • Everyone at CTIO and Gemini involved in the REU/PIA programs for sharing their knowledge and giving their support • This research was supported by the National Science Foundation (NSF) grant No. 0353843
Create BCG Catalog • Using C4 Cluster Catalog with BCG guess using sdss data • Categorize each guess to sift out obvious BCGS • Category 1: brightest galaxy in the cluster by 0.1 magnitudes, within 500 kp from luminosity center of cluster, • Category 2: another brighter galaxy (not the guess), brightest by 0.1 mags, within 500 kp from luminosity center of cluster, • Category 3: hard to tell
Checking the Reliability of BCG choices and data • Photo z v. spectro z • Achival research: compare our choice BCGs with those of LP • There is a known problem with the SDSS magnitudes for very bright galaxies: SDSS tends to overestimate the local sky/ back ground, so when it subtracts it from the mag of galaxy, it underestimates the mag of galaxy. We are using a program to correct the magnitudes for all the galaxies
BCG environmental analysis • Density in 150kp radius for all gals • projected surface density of galaxies around BCG correlated to: • Luminosity? • Xray? • UV? • IR? • Ellipticity? • Z? • Velocity of cluster rotation
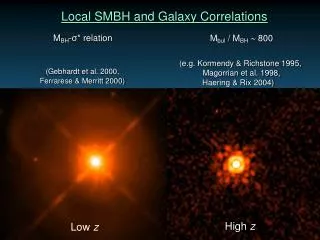
The surface brightness profiles (SBPs) of BCGs are well fit by the same S´ersic (1963) law that describes less-luminous spheroids (Graham et al. 1996), apart from the outermost regions which sometimes exhibit faint, extended envelopes (Oemler 1976; Bernardi et al. 2006, hereafter B06). BCGs also appear to obey the same relations between fitting parameters that characterize E/S0 galaxies generally (Graham et al. 1996). Lauer et al. (2006, hereafter L06) noted that the M•−L relation, in the V-band (M• −LV), predicts higher SMBH masses in BCGs than are predicted by the M•−∗ relation.