Download
1 / 19
190 likes | 344 Views
Problem Solving In a World of Constant Change John G. Mathers 2013. Growing a Business is Challenging!. Macro. Micro. I ncome Output Consumption Unemployment Inflation Savings Investment Intl trade Intl finance Regs. Governance. Risk. Demand Supply Costs Pricing Channels

E N D
Problem Solving In a World of Constant Change John G. Mathers 2013
Growing a Business is Challenging! Macro Micro • Income • Output • Consumption • Unemployment • Inflation • Savings • Investment • Intl trade • Intl finance • Regs Governance Risk • Demand • Supply • Costs • Pricing • Channels • Competitors • Labor Technology GrowthStrategy Operations Regs Sustainability Talent
So Willingness to Change is Required! “All great changes are preceded by chaos.” Deepak ChopraSpiritual Guide “Understanding is the first step to acceptance, and only with acceptance can there be recovery.” J.K. RowlingWriter
And Change Means … Your Mental Map! “When the structure of the industry [or a market … or a business] changes, all of the elements change too. The mental map that you have been carrying with you all these years and relied upon in charting your company's course of action suddenly loses its validity … [and] you haven't had a chance to replace it with a new mental map.” Andy Grove Only the Paranoid Survive
Becoming an Extraordinary Business John Mathers & Bill Daniels Change-ABLE Organization “Successful organizations that have sustained rapid growth for years while achieving even higher levels of efficiency and quality have change woven into the very fabric of the organization. Like a school of fish these organizations are constantly moving -- they are fast, focused and extremely flexible.”
R Our Answer C EFFECT Lots of Problem-Solving Tools -/+ Plus Minus Affinity Interrelationship Diagram Stakeholder Cause Effect Diagram Solution Grid
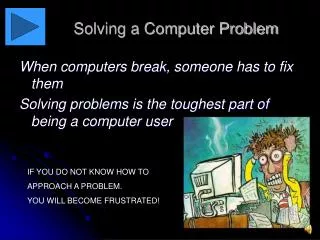
But Where to Start? Most Common Approach to Problem-Solving ASSUMPTIONS OUTCOME and Mismatch to Expectations ACTION Primary Response to Mismatch: CHANGE THE ACTION
OUTCOME: Mismatch to Expectations ACTION Most Effective Approach:Double Loop Learning GOVERNING VALUES & ASSUMPTIONS Single Loop Primary Response to Mismatch: CHALLENGE THE VALUES and ASSUMPTIONS
The Learning Environment SUCCESS CEO/Pres “Making Progress” Board Management Threat and Fear ASSUMPTIONS ACTION Blaming or “Fight” Resignation or “Flight” FAILURE Single Loop: Correction LEARNING Double Loop: Reflection graphic based upon materials from Dr. W. E. Deming and Dr. J. D. Milojkovic
Overview of Problem-Solving Process Generate Analyze Plan 50% Gather Data 30% Interpret Data 20% Plan Actions
Affinity Diagram • WHEN: • To gather and organize large amounts of data into natural groupings of ideas, opinions or issues. HOW: • Define the topic • Generate and record ideas on cards • Display the cards (leave room) • Arrange the cards into columns of random, but related themes • Define the related themes and create the "Header Cards" • Draw the finished affinity
R C Interrelationship Digraph WHEN: To identify the sequential relationships among ideas/issues HOW: • Agree on issue/problem statement • Display cards • Draw relationship arrows • Get feedback, then review and revise • Tally the incoming/outgoing arrows • Incoming = Results • Outgoing = Major Causes • Select Key Items and Draw final ID • Check the results against your common sense
EFFECT Cause and Effect Diagram WHEN: To visually display and examine the possible root causes of a specific problem or opportunity. HOW: • Define Problem Statement • Draw the "C&E" Diagram, using the "4Ps" or “4Ms” • Generate and plot a list of causes on the "C&E" Diagram • Ask "Why?" 5 times to ensure root cause analysis • Identify the Most Likely Causes
People Processes Assumptions Materials Documentation Equipment Direction Decisions etc. Cause and Effect Diagramming EFFECT
Stakeholder Stakeholder Stakeholder Our Answer Stakeholder Stakeholder Stakeholder Stakeholder Stakeholder Stakeholders
Stakeholder Analysis 1) Define Problem/Opportunity Statement and Desirable Outcomes 2) List Stakeholders 3) Assess Current Level of Commitment to Outcomes 4) Define Issues that are of concern to each stakeholder 5) Propose possible Responses to the Concerns
A. Brainstorm Ideas List on page B. Select Criteria Weight them if appropriate The Solution Grid C. Compare each idea to the criteria • Highest number is better D. Look at the Grid -- Use Common Sense
Speeding the natural evolution of your business 3020 Bridgeway, Suite 414, Sausalito CA 94965 Tel: 1 (415) 381-4660 Email: info@eVoassociates.comWeb: www.eVoassociates.com