Download
1 / 1
10 likes | 127 Views
Interannual Variations in Stratospheric Water Vapor. J.N. Lee 1 , Y. Kawatani 2 , and K. Hamilton 3 1 NASA Goddard Space Flight Center, 2 JAMSTEC RIGC , 3 IPRC. Specific humidity mean annual cycle (ppmv).

E N D
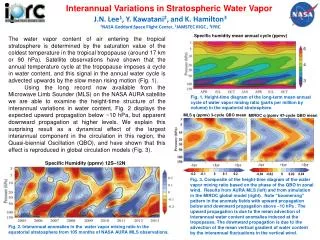
Interannual Variations in Stratospheric Water Vapor J.N. Lee1, Y. Kawatani2, and K. Hamilton3 1NASA Goddard Space Flight Center, 2JAMSTEC RIGC , 3IPRC Specific humidity mean annual cycle (ppmv) The water vapor content of air entering the tropical stratosphere is determined by the saturation value of the coldest temperature in the tropical tropopause (around 17 km or 90 hPa). Satellite observations have shown that the annual temperature cycle at the tropopause imposes a cycle in water content, and this signal in the annual water cycle is advected upwards by the slow mean rising motion (Fig. 1). Using the long record now available from the Microwave Limb Sounder (MLS) on the NASA AURA satellite we are able to examine the height-time structure of the interannual variations in water content. Fig. 2 displays the expected upward propagation below ~10 hPa, but apparent downward propagation at higher levels. We explain this surprising result as a dynamical effect of the largest interannual component in the circulation in this region, the Quasi-biennial Oscillation (QBO), and have shown that this effect is reproduced in global circulation models (Fig. 3). 6 4 3 Fig. 1. Height-time diagram of the long-term mean annual cycle of water vapor mixing ratio (parts per million by volume) in the equatorial stratosphere. MLS q (ppmv) 3-cycle QBO mean MIROC q (ppmv 47-cycle QBO mean Specific Humidity (ppmv) 12S–12N Fig. 3. Composite of the height-time diagram of the water vapor mixing ratio based on the phase of the QBO in zonal wind. Results from AURA MLS (left) and from simulation in the MIROC global model (right). Note “boomerang” pattern in the anomaly fields with upward propagation below and downward propagation above ~10 hPa . The upward propagation is due to the mean advection of interannual water content anomalies induced at the tropopause. The downward propagation is due to the advection of the mean vertical gradient of water content by the interannual fluctuations in the vertical wind. -0.2 -0.1 0 0.1 0.2 -0.04 -0.02 0 0.02 0.04 Fig. 2. Interannual anomalies in the water vapor mixing ratio in the equatorial stratosphere from 105 months of NASA AURA MLS observations.