Download
1 / 9
90 likes | 262 Views
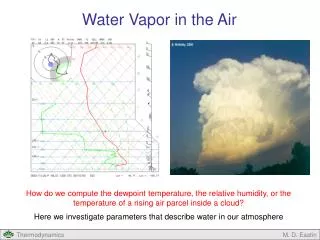
Water Vapor Radiometer. Development project Not in EVLA baseline plans If successful, has implications for EVLA. WVR….why?. Water vapor emission in the atmosphere increases electrical path length resulting in phase fluctuations in the astronomical data

E N D
Water Vapor Radiometer Development project Not in EVLA baseline plans If successful, has implications for EVLA Feed & Front End PDR 12-13 Feb 2002
WVR….why? • Water vapor emission in the atmosphere increases electrical path length resulting in phase fluctuations in the astronomical data • The effect of these fluctuations is greater at shorter wavelengths • Measuring fluctuation of the amplitude of water vapor emission at 22 GHz enables a phase correction to be generated and applied to astronomical data Feed & Front End PDR 12-13 Feb 2002
A three channel system for EVLA Deg (K) • An optimized EVLA WVR design would include channel spacing as near the K band edge as possible 20 15 10 5 15 20 25 Frequency (GHz) (From Butler 1999) Feed & Front End PDR 12-13 Feb 2002
Current WVR system • The current WVR detection scheme uses three channels centered on the water line • The bandwidth and frequency of the channels are limited by RFI generated in the present LO scheme (From Butler 1999) Feed & Front End PDR 12-13 Feb 2002
WVR block diagram Feed & Front End PDR 12-13 Feb 2002
Requirements • Defined by need to measure Q band phase fluctuations to 10 deg rms • Fractional amplitude stability of 10–4 • Timescales 2 sec to 30 min Feed & Front End PDR 12-13 Feb 2002
Recent WVR ‘LAB’ prototype stability measurements, using a Noisecom ND as the source Feed & Front End PDR 12-13 Feb 2002
WVR stability measurements using K band #17 and a ‘hot’ load as source Feed & Front End PDR 12-13 Feb 2002
WVR plans • Install 2 prototypes Spring 2002 • Evaluate existing design Spring/summer 2002 • If successful, need 1 system/antenna. • EVLA implications are: • Ku, K, Ka, Q band Rx adjacent on feed ring • LOs must not coincide with WVR channels • Space for WVR electronics in feed circle • Interface to monitor and control Feed & Front End PDR 12-13 Feb 2002