Download
1 / 23
230 likes | 332 Views
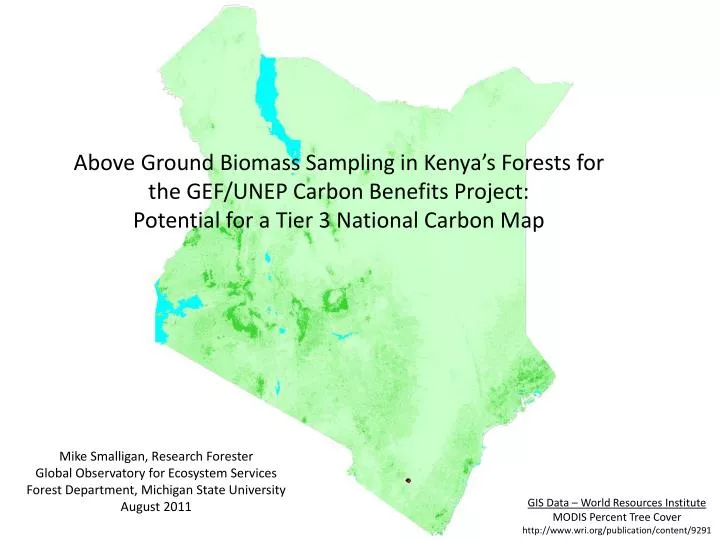
Above Ground Biomass Sampling in Kenya’s Forests for the GEF/UNEP Carbon Benefits Project: Potential for a Tier 3 National Carbon Map . Mike Smalligan, Research Forester Global Observatory for Ecosystem Services Forest Department, Michigan State University August 2011.

E N D
Above Ground Biomass Sampling in Kenya’s Forests for the GEF/UNEP Carbon Benefits Project: Potential for a Tier 3 National Carbon Map Mike Smalligan, Research Forester Global Observatory for Ecosystem Services Forest Department, Michigan State University August 2011 GIS Data – World Resources Institute MODIS Percent Tree Cover http://www.wri.org/publication/content/9291
Location of MSU Biomass Sampling Central: Aberdares Mt Kenya Western: Kakamega Mau Lambwe Eastern: Arabuko-Sokoke Tsavo GIS Data – World Resources Institute Closed Forest (>65%) Open forest (40-65%) Very Open Forest (15-40%)
Number of Fixed Area Biomass Plots • MSU has collected 144 biomass plots throughout Kenya • MSU established partnerships with other organizations (GOK, NGOs, researchers) • that have shared their 411 plots of biomass field data
Above Ground Biomass in Plantation Forests (MSU data only – t C/ha) Tier 1 AGB tC/ha Moist >20yrs - Broadleaf 71 - Pinus 56 Montane>20yrs - Broadleaf 71 - Pinus 47 Source: Table 4.8 in Vol 4, 2006 IPCC Guidelines Central: Aberdares Mt Kenya Western: Kakamega Mau Lambwe 84.3 tC/ha n=34 88.6 tC/ha n=27 79.9 tC/ha n=2 66.4 tC/ha n=22 15.8 tC/ha n=1 GIS Data – World Resources Institute MODIS Percent Tree Cover http://www.wri.org/publication/content/9291
Above Ground Biomass in Natural Forests (MSU data only – t C/ha) Tier 1 AGB tC/ha Wet 146 Moist 122 Montane 89 Dry 56 Shrub 33 Source: Table 4.7 in Vol 4, 2006 IPCC Guidelines Western: Kakamega Mau 126.6 tC/ha n=20 86.5 tC/ha n=3 Eastern: Arabuko-Sokoke Tsavo 33.2 tC/ha n=6 7.7 tC/ha n=3 GIS Data – World Resources Institute MODIS Percent Tree Cover http://www.wri.org/publication/content/9291
WRI Forest Land Cover Map does not classify dry forests in SE Kenya GIS Data – World Resources Institute Closed Forest (>65%) Open forest (40-65%) Very Open Forest (15-40%) http://www.wri.org/publication/content/9291
Transects in Rukinga Ranch classified as “open shrubs” GIS Data – World Resources Institute Closed Shrubs Open Shrubs (45-40%) Open Low Shrubs (65-40%) http://www.wri.org/publication/content/9291
Closed Canopy Forests correlated with Annual Rainfall Forest Approx. Rainfall Kakamega >1700 Aberdares >1700 Mt Kenya >1700 Mau 800-1700 Lambwe 1200-1400 Arabuko 1000 Tsavo 500-800 Potential correlation with dry forest land cover GIS Data – World Resources Institute Kenya annual Rainfall http://www.wri.org/publication/content/9291
FAO Ecofloristic Zones for Kenya with closed forests Data from http://cdiac.ornl.gov/epubs/ndp/global_carbon/carbon_documentation.html and WRI Land Cover
FAO Ecofloristic Zones outlined on WRI Annual Rainfall Apply carbon values to Landsat forest fractional cover map according to ecofloristic zone modified by annual rainfall
Kakamega Forest • Easternmost equatorial rainforest in Africa • Project Partners: ICRAF, Eco2librium, Glenday • 54 sample plots in the forest land cover • 20 plots in natural forest – 126.6 tC/ha • 34 plots in plantations – 84.3 tC/ha • Overall forest carbon density of 100 tC/ha (n=54) • 21 sample plots in landscapes with trees outside the forest • 13 plots in agriculture – 13.9 tC/ha • 8 plots in fencerows – 37.2 tC/ha • Overall landscape carbon density of 22.8 tC/ha (n=21)
Kakamega Forest - External Data Sources • Glenday and Eco2librium used IPCC Moist Forest equations (based on Brown 97) to determine biomass • Glenday - 200 t C/ha AGB for indigenous forests (n=46) • Eco2librium - 191 t C/ha AGB for indigenous forests (n=95) • IPCC Moist overestimates AGB compared to CBP equations by ~35% • Eco2librium – 191 t C/ha for indigenous only • AGB drops 36% to 121 t C/ha using CBP allometry • Glenday – 207 t C/ha for indigenous forest (MSU analysis of Glenday data) • AGB drops 37% to 131 t C/ha using CBP allometry • Glenday – 134.3 t C/ha for plantation forests (MSU analysis of Glenday data) • AGB drops 30% to 94.9 t C/ha using CBP allometry • MSU measured 126.6 t C/ha in natural forests (n=20) • Average of adjusted Glenday and Eco2librium is 124.6 t C/ha (n=141)
CBP – New Allometry for Yala Watershed • The Yala River originates in the NW corner of the Mau forest complex and flows west to Lake Victoria along the southern edge of the Kakamega Forest • 1200-2200 m elevation, 1500 mm annual rainfall, 20° C mean annual temperature • ICRAF developed general allometric equations for multiple tree species in the Yala Watershed • ICRAF destructively sampled more than 84 trees • 16 in Lower Yala, 38 in Middle Yala, 18 in Upper Yala for equations • Additional 12 trees harvested to validate the models • ICRAF developed allometric equations to predict above ground biomass using DBH (cm) or crown area (m2) as inputs • AGB = exp(-2.403) * (DBH^2.472) • AGB = exp(1.8128) * (crown area^1.2535) • BGB = AGB * 0.24
Mau Forest • Largest forest complex in Kenya • Project Partners: none • 5 sample plots in the forest • 3 plots in natural forest – 86.5 t C/ha • 2 plots in plantations – 79.9 t C/ha • Overall forest carbon density of 83.8 t C/ha (n=5) • No sample plots in landscapes outside the forest • External Data Sources: none • Use CBP allometric equation
Lower Nyando and Lambwe Forest • Project Partners: ICRAF • 1 sample plot in the Lambwe Forest • No plots in natural forest • 1 plot in a young cypress plantation – 15.8 t C/ha • 5 sample plots in non-forest landscapes in the lower Nyando Watershed • 5 ICRAF agroforestry demonstration plots – 18.7 t C/ha • External Data Sources: none • Use Brown 97 Dry forests allometry
Mount Kenya • Project Partners: KEFRI • These data are a partial revisit of a 2009 KEFRI inventory for plantation biomass carbon • Potential for determining biomass growth rates in plantation forests • 27 sample plots in the forest • No plots in the natural forest • 27 plots in plantations of various ages and species – 88.6 t C/ha • 5 plots in very old Juniperusproserahave AGB of 171.5 t C/ha • No sample plots in landscapes outside the forest • External Data Sources: KEFRI • 2009 KEFRI inventory used volume equations to determine biomass • Use CBP allometric equation
Aberdares • Project Partners: KEFRI • These data are a partial revisit of a 2009 KEFRI inventory for plantation biomass carbon • Potential for determining biomass growth rates in plantation forests • 22 sample plots in the forest • No plots in the natural forest • 22 plots in plantations of various ages and species – 66.4 t C/ha • No sample plots in landscapes outside the forest • External Data Sources: KEFRI • 2009 KEFRI inventory used volume equations to determine biomass • Use CBP allometric equation
Arabuko-Sokoke Forest • Largest intact coastal dry forest in Kenya • Project Partners: KEFRI, Glenday • KEFRI has 21 permanent sample plots in A-S • 6 sample plots in the forest (outside the PSP) • 6 plots in the natural forest – 33.2 tC/ha • No plots in plantations • No sample plots in landscapes outside the forest • External Data Sources: KEFRI, Glenday • KEFRI did not determine biomass in their permanent sample plots • Analysis of Glenday data: AGB = 38 t C/ha (n=97) • Both MSU and Glenday used Brown 97 dry forest equations
Arabuko-Sokoke Forest – External Data Sources Comparison of 6 MSU fixed area plots in several forest types with Glenday Data
Tsavo Dry Forests • Wildlife Work’s Rukinga Ranch is first VCS REDD project in Africa • Project Partners: Wildlife Works • 3 sample plots in the forest (revisit of 3 WW plots) • 3 plots in natural forest – 7.7 t C/ha • No plots in plantations • No sample plots in landscapes outside the forest • External Data Sources: Wildlife Works • Very large database for VCS project – 115 fixed area plots • Wildlife Works developed their own species and general allometric equations • Use WW general allometric equation • WW reports area weighted mean of 7.9 t C/ha (6 strata in 30,000 ha) • WW used their species level equations; MSU used WW general equation
Biomass Conclusions • Indigenous forests in western Kenya: AGB = 124.1 tC/ha • 3 independent data sets are ±9.3% at 95% CL (n=164) • IPCC Tier 1 defaults are very close for moist and montane • Plantation forests in western Kenya: AGB = 84.3 t C/ha • Very heterogeneous according to species and age but the mean of 3 independent data sets are ±12.5% at 95% CL (n=119) • IPCC Tier 1 defaults appear to underestimate biomass in Kenyan plantations • Non-forest landscapes in western Kenya: AGB = 22.8 t C/ha • Very heterogeneous land use systems with ±53.6% at 95% CL (n=21) • Coastal forests in eastern Kenya: AGB = 37.7 • 2 independent data sets are ±9.0% at 95% CL (n=103) • IPCC Tier 1 defaults are almost double our field measurements for dry coastal forests • Inland dry forests in eastern Kenya: AGB = 10.6 t Ch/ha • WW area weighted mean is 7.9 t C/ha • 2 independent data sets are ±14.4% at 95% CL (n=116) • IPCC Tier 1 defaults are 4x higher than our field measurements for “shrub” land cover
Recommendations for a National Remote Sensing Map for REDD • Use wall to wall Landsat analysis to develop a forest / non- forest land cover map for all of Kenya • Use Fractional Cover or Disturbance Index to down calibrate forest cover • Identify natural and plantation forests • Use field inventory data for AGB to determine the carbon density of specific ecosystems and forest types (natural or plantation) • Use FAO Ecofloristic Zones with Annual Rainfall and/or Elevation to stratify carbon density for national map • Tropical rainforest = IPCC • Tropical moist = IPCC • Tropical montane • 1000 to 2000 m = 124 t C/ha natural and 84 t C/ha plantation • >2000 m = 87 t C/ha natural and 80 t C/ha plantation • Non-forest = 23 t C/ha if >1000 mm • Tropical dry = 38 t C/ha • Tropical Shubland • > 500 mm = 10 t C/ha • < 500 mm = 0 t C/ha