Download
1 / 26
260 likes | 517 Views
Texas Smart Grid Consortium November 8 th 2010. Remove the Complexity. Transition Probability Chaos Theory attractors Signal to Noise ratio MultiColinearity. Transition Probability Golden Shiner. Hatchling. 5%. 20%. Juvenile. Egg. 80%. Pond Scum. Transition Probability.

E N D
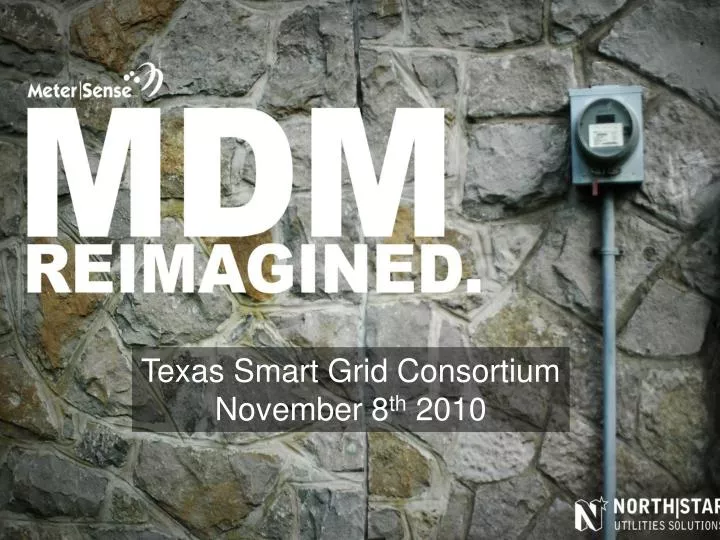
Texas Smart Grid Consortium November 8th 2010
Remove the Complexity • Transition Probability • Chaos Theory attractors • Signal to Noise ratio • MultiColinearity
Transition Probability Golden Shiner Hatchling 5% 20% Juvenile Egg 80% Pond Scum
Transition Probability Late Night Infomercial 40% Super Star 10% Rehab 40% Security Guard 20% Child Star “Adult” Star 20% Politician 70% Pond Scum 100%
Transition Probability AMI Data Cleansing MeterSense Repository Versioning Auditing Aggregation 100% Quality Reads 92% Metersense Certified 10 rules Based Validation routines 98% 6% Interval Read Poor Signal Quality 99% Estimate Override Edit Guide Edits Pond Scum 2% Service Orders 2% 1%
Ratios Signal to Noise Noise Hear Can’t Hear Hear Clearly Signal
Ratios Port-a-Potty Behavior Disgust Can’t Refuse Won’t Use Locked Inside Taking a Snooze Desperation Alcohol
Ratios MultiCollinearity Complexity of Integration Use Won’t Use Drives Innovation Data Quality Amount of Data
Chaos Theory Attractors
Chaos Theory Attractors Attractor
Chaos Theory Attractors
Chaos Theory Attractors
Time based rates comparison Savings Savings $111.00 Avg. Temp 25 F Flat Rate Time of Use Rate Total Cost Total Cost $534.00 $645.00 Total Kwh Total Kwh 1145 1037 $2.96 $3.58 Daily Cost Daily Cost 558 610 On Peak On Peak
MDM Iphone / Android structure BPO Decision Automation • Identify high line losses • Loss revenue loss protection • Blink momentary interruption analysis • Secondary line theft Identification • Balance Primary loads • Phase Balancing and circuit utilization • Equipment trouble shooting • Transformer optimization incorporated with weather conditions • Scheduled Preventative Maintenance • Improve Voltage regulation and capacitor placement • Customer load profiles • Customer class load profiles • Network location load profiles • Top contributors to system peaks • Water non-compliance usage • Water leak detection • Water main leak detection • Water pressure analysis Reporting Structure Application sharing Engineering Firms Consultants User Community Web Based sharing engine
Electric Distribution Line Loss Wholesale Energy Purchases – Retail Member energy sales = Lost revenue
Load Analytics Peak Load Contribution by Rate Class
Diagnostic System Losses Causes; Theft, Meter issues, Voltage variance, equipment sizing placement, disturbances Loss 4-8%
System Line Loss Report Top Circuit line loss by percentage of revenue Total Losses for this period Same Period last year Select System
Diagnostic System Losses Secondary Power Theft Loss 4-8%
Municipal Utility Energy Demand 30 to 40 percent of the electricity is used by water utilities Reduce Peak demand charges by 20% Run Pumps Off Peak Identify Lift Station Malfunctions
Conservation Monitoring Conservation and threshold monitoring of specific energy classes allowing performance comparison and Device monitoring and Energy Resource Management
Charleston SC. expects to save $18.5 million over 15yrs through performance contracts that include saving water and energy. Galveston TX. Through more accurate water meters expects to save $1.3 million per year Glendale WI. Water Efficiency contributes to LEED certification