Download
1 / 27
270 likes | 473 Views
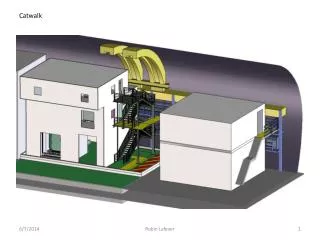
Supermodels – Gossip from the Catwalk. John Walker Crime Trends Analysis for the OESR/JMAG Justice Modelling Workshop Brisbane October 2005 Presents…. Conference Themes: The development and use of models in social and justice organisations. .

E N D
Supermodels – Gossip from the Catwalk John Walker Crime Trends Analysis for the OESR/JMAG Justice Modelling Workshop Brisbane October 2005 Presents…
Conference Themes: The development and use of models in social and justice organisations. • The types of models that are of interest include: • Simulation; Spatial; Temporal; Trajectory; Policy; Economic (cost-benefit analysis), and Resource allocation. • Models Come in All Shapes and Sizes • Petite Models e.g. • Court-room Capacity models, Staffing Needs models • Size 16-26 Models e.g. • Justice System models, Accessibility models, Funding Allocation models • B – I – B “Supersize me” Models e.g. • Transnational Crime, Drugs & Money Laundering models
Every Aussie knows the fundamentals of Modelling. • Databases, Algebra and Regression Equations • Incomprehensible statistical stuff ? • Aussies know more than they think they do! • Aussie newspapers – even the tabloids - are filled with databases and regression models, and Aussies study them carefully. • 11.17.83 ? • 11.17.83 ? • We write this as: TS = 6*G + 1*B + 0 • Aussies recognise that this set of numbers represents: [a] a mediocre level of kicking accuracy, and [b] the regression equation: Total Score = 6 times the numbers of goals, plus the number of behinds. • “11.17.83” is a total mystery even to mathematically-minded people elsewhere. To Americans it’s the date in 1983 when Magic Johnson scored 22 assists for Cleveland against the L.A. Lakers – who cares!
Regression Analysis - natural way to look at data Just suppose we don’t know exactly how the total match points were calculated. We might look at the table and think that the number of wins or the number of points for seem to be the most significant determinants of TMP. The charts support our first hypothesis rather than our second. The R2 measures how closely the points are to the lines. Hypothesis 1: TMP = 4 * Number of Wins + 0 Hypothesis2:
The AFL Ladder is a Database 2-stage regression model: F=6*G + B + 0 TMP = 4*W + 2*D + 0 Game characteristics Game Score Match Points Ladder position Fan Satisfaction
The Victoria Police Human Resource Allocation Model is a database with the same structure as the AFL ladder Variables selected on the basis of their common sense relationships with policing, their statistical explanatory power, their availability at the district level and the frequency with which they can be updated: - Total population; - Numbers of indigenous people - Persons aged 20 years and below; - Population growth rate of people below the age of 20 - Retail turnover - Family violence reports - Numbers of Liquor Licenses - Numbers of Black Spot intersections, - Numbers of Major Events, - Numbers of Stations with Police Cells, and - Point of Presence Service considerations (how many stations needed to cover the district).
The Victoria Police HRAM is also a two-stage regression model Stage 1 Regressions Stage 2 Regression Equation4 Equation 1 Equation2 Equation3 Equation 5 Community characteristics Crime & Road Trauma Calls on Police Police Resources Public Satisfaction
1 1 1 1 1 1 1 3 3 3 3 3 3 3 2 2 2 2 2 2 2 4 4 4 4 4 4 4 5 5 5 5 5 5 5 6 6 6 6 6 6 6 1 1 1 1 1 1 1 7 7 7 7 7 7 7 8 8 8 8 8 8 8 9 9 9 9 9 9 9 Forecasting in the Justice System…. The Trend Analysis The Environmental Scan ?????? The Scenarios The Projections The Budget The Workshop Trends in Community Characteristics Trends in Crime & Road Trauma Trends in Police Responses Trends in Courts Responses Trends in Correctional Populations Strategic Planning and Budgeting
What do we want? Prisons for criminals! When do we want them? Now! Where do we want them? Not Near ME! Not Near ME! What do we want? Emergency Services! When do we want them? Now! Where do we want them? Near ME! Near ME! DoJ Accessibility Modelling for Future Demand Location of services is important. How can Service Providers respond to these competing and conflicting demands? Trends in Settlement Patterns Trends in Regional Demands for Services Trends in Service Characteristics Equity & Access considerations Trends in Service Responses Strategic Planning and Budgeting
Time to think B-I-B? • In the micro and mid-size sections of the scale, modelling to support “evidence-based” strategic planning is now common in the criminal justice system in Victoria • Staff allocation models police (Peter Kewu Li) • Demand Projection and Service Accessibility models for prosecutions, civil and criminal courts, prisons, community corrections, sentencing and forensic services (See previous JMAG conferences) • At the B-I-B end, the U.N. has been told for decades that global modelling of crime and justice is not possible. This myth was shattered in 2005.
Valuing the Global Illicit Drug Markets – 1980-2004 • Numerous attempts to quantify Illicit Drugs markets in the past, • The Financial Action Task Force (FATF) estimated in the late 1980s, sales of cocaine, heroin and cannabis approximated $124 billion per year in the US and Europe, equivalent today to some $200 billion • OECD, FATF Working Group on Statistical and Methods, Narcotics Money Laundering - Assessment of Scale of the Problem, 1989, Financial Action Task Force on Money Laundering, report, 1990. • Based on 1995 drug production estimates, UNDCP arrived at a global estimate of $85 billion to $1000 billion [1]. Given this broad range and the uncertain validity of assumptions made, UNDCPs’ 1997 World Drug Report, spoke of a likely turnover of around $400 billion [2]. Questioned by some experts as possibly too high. However, no alternative calculations were provided. • [1] UNDCP, Economic and Social Consequences of Drug Abuse and Illicit Trafficking, (Technical Series 1997). • [2] UNDCP, World Drug Report, (Oxford University Press 1997). • In the late 1990s, the Financial Action Task Force experts could not agree on the most appropriate methodological approach - top-down or bottom-up. Recommendations made to countries to improve data collection systems and to undertake drug market estimates at the national level. • OECD Financial Action Task Force, Report of the FATF Ad Hoc Group on Estimating the Magnitude of Money Laundering on Assessing Alternative Methodologies for Estimating Revenues from Illicit Drugs (2000).
Valuing the Global Illicit Drug Markets - 2005 • Information on the value of the drug sector and consequently the analysis of various aspects of the implication of money laundering was a gap in the otherwise comprehensive coverage of the World Drug Report. • One of the reasons for this is that the measurement of such activities is difficult and prone to criticism. It is, however, a vital element of the global drug control equation. • Project Outputs: • An estimate of the value of the retail and wholesale markets for heroin/opium, coca/cocaine, cannabis, and Amphetamine-Type Substances, • a report documenting these results and methodologies used to derive them, • a data base, complete documentation of the data base, • an evaluation of the feasibility of applying these methods to other illicit markets. John Walker Crime Trends Analysis for the United Nations Office on Drugs and Crime World Drug Report 2005
Obvious Truths and Heresies… • Illicit drugs constitute a trans-national industry, just like the motor industry. • Both industries market a wide range of products, at a wide range of prices. • In both industries, production of key components is concentrated in a few countries, but final products are distributed to many (all?). • Both industries are subject to heavy burdens of taxes, regulation and stock shrinkage. • Both industries’ products are addictive and can be dangerous – users build their whole lives around their use, and sometimes shorten them. • To an engineer, a botanist or a chemist, these industries are very different. • To an economist, they are identical. • They have production costs that vary from place to place. • They produce a range of products that compete for customers, horizontally (e.g. different products) and vertically (different suppliers). • There is price competition and there are substitution effects. • They have distribution networks that are subject to a variety of economic pressures. • They have marketing strategies that emphasise factors such as customer loyalty (addiction?) and “trendiness.” • They are sometimes indifferent to the poor safety features inherent in their products, which creates the need for regulation.
The Structure of the Industry • Many different drug types – new “models” always being marketed • Many different producer countries – different products • Many different consumer countries – different preferences • Fits the Multinational Input-Output model framework
Top-down or Bottom-up approach? • Top-down (start with the row and column totals): • Look for global or regional aggregates of production, consumption • Look for global average prices • Multiply and sum across drug types • Bottom-up (start by trying to fill the rows and columns of the matrix): • Look for country-level aggregates of production, consumption • Look for country-level average prices • Multiply and sum across drug types and countries • Problems with both: • Few credible findings on global aggregate data • Many gaps in country-level data
A set of interconnected Excel spreadsheets One sub-model for each drug type A Link Model to incorporate theories of drug substitutability and price elasticities, and to bring together all the submodels into an overall model of illicit drugs. We developed… • This gives maximum flexibility for future modeling, including: • Ability to add new drug types • Ability to model different drug types with different process models
A Model like this… • Is stable and will not become outdated by new theories • Allows easy and flexible data entry • Facilitates clear statement of assumptions • Allows for new drug types (sub-models) • Highlights inconsistencies in input data • Permits extraction of results at any stage of production and consumption processes • Permits aggregation of results to any regional structure or across groupings of drug types • Allows easy sensitivity analysis • Supports forecasting techniques
Production and Transfer to Markets: [1] “Total available for Wholesale” = “Total Production” – “Seizures/losses in the source country”, and [2] “Producer Income” = “Total available for Sale” * average “Farm gate price” In “ Demand-constrained” regions, total consumption is estimated by multiplying the estimated numbers of users in the region by the estimated annual consumption per user. This will be generally the case in producer and transit countries and regions, where supply is plentiful relative to demand. [3] “Estimated Actual Consumption” = "Estimated User Population" * "Average Consumption per user ", and [4] “Total Transferred to Markets” = "Estimated Actual Consumption" + "Total Seized/Lost at Destination“ In "Supply-constrained" regions, Total Transferred to Markets is estimated from the data on the Total Seized/Lost in Transit, using the research finding that seizure rates are reasonable indicators of relative consumption around the world, and are consistent over time. [5] “Total Transferred to Markets” = "Total Seized/Lost in Transit " / ["Global Seizure rate” * “Regional adjustment"] In the first step in model calibration, the value for the global seizure rate is chosen so that the truism “supply=demand” is achieved: [6] ∑“Total Transferred to Markets” [from producers] = ∑“Total available for Sale”[in consumer regions]
The Wholesale and Retail Markets: [7] “Total Available for Consumption” = “Total Intended for Consumption” – “Total Seized/Lost at Destination”, and [8] “Gross Wholesaler Income” = “Total Available for Consumption” * “Wholesale price at Destination” Retailers of illicit drugs, like any other retail business, face “leakage and shrinkage” problems. Leakage and shrinkage is a euphemism for stock losses from thefts and deterioration. Leakage and shrinkage are only a significant issue in supply constrained regions; in demand constrained regions, by definition, supply matches demand. For each supply constrained region, therefore: [9] “Estimated Actual Consumption” = "Total Available for Consumption” – “Leakage and shrinkage”, while if the region is defined as “demand constrained”: [10] “Estimated Actual Consumption” = “Estimated User Population” * “Average Consumption per user”, If the calculated usage rates are inconsistent with other findings, it is likely that there are related to assumptions regarding seizure rates, and these should be reconsidered. Then, in all regions: [11] “Implied Consumption per user” = “Estimated Actual Consumption” / “Estimated User Population”. Once, the user is satisfied that the model is providing credible estimates of consumption per user in all regions, gross retailer income can now also be calculated: [12] “Gross Retailer Income” = “Estimated Actual Consumption” * “Average Unit Retail Price”
The Geographic Dimension Using Transportation Maths to Analyse Transnational Crime and Illicit Drugs John Walker March 2005
Towards a “Trafficking Harm Index” • Harm is caused by Illicit Drugs/firearms/people trafficking, etc etc) • In the country of origin/production: • Diversion of economic activity into crime • Corruption/violence to protect illegal activities • Easy availability of trafficked good/services in domestic market • In the country of destination/consumption: • Diversion of economic activity into crime; excess profits to criminals • Corruption/violence to protect illegal activities • Health/poverty impacts of trafficked good/services • This harm can generally be measured fairly directly as economic costs in the origin and destination countries
Towards a “Trafficking Harm Index” • Harm is ALSO caused by Illicit Drugs/firearms/people trafficking, etc etc) • In the countries through which the trafficked goods/services transit: • Mainly corruption/violence to ensure passage of illegal goods/services • To measure this harm, we need to: • Identify the transit routes taken by the traffickers • Allocate harm according to some logic – eg proportionate to the fraction of the trafficked goods/services that use each country in transit.
Contiguous countries Shipping links Towards a “Trafficking Harm Index” • A general model that can “predict” trafficking route options would need to consider that: • Transnational trafficking (by definition) crosses international borders by land, sea or air • Land or sea transport routes permit bulky goods; air transport generally doesn’t • Some countries’ borders are more “porous” than others • Land routes can only connect pairs of “contiguous” countries • Sea routes can only connect sea ports
Towards a “Trafficking Harm Index” Some “beautiful” maths starts with a simple “link/no link” matrix • This particular matrix is very special, because if you multiply it by itself, it gives the number of routes between pairs of countries VIA A THIRD country. All routes can be identified by the list of countries they pass through. • The possible routes between A and D are - A(E)D and A(B)D • The possible routes between G and F are - G(C)F, G(ED)F and G(CBD)F …and so on. • If we know that a quantity of drugs, firearms or laundered money travels from G to F, it can take these routes. • Harm is scattered along its trail. Country D Country F Country E Country B Country A Country C Country G