Download
1 / 24
240 likes | 422 Views
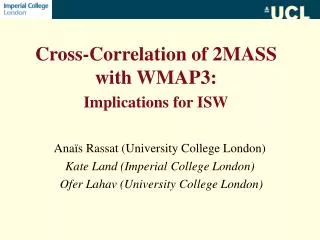
Cross-Correlation of 2MASS with WMAP3: Implications for ISW. Ana ïs Rassat (University College London) Kate Land (Imperial College London) Ofer Lahav (University College London). Integrated Sachs-Wolfe Effect. 2MASS Galaxy Survey. Publicly available eXtended Source Catalogue (XSC)

E N D
Cross-Correlation of 2MASS with WMAP3: Implications for ISW Anaïs Rassat (University College London) Kate Land (Imperial College London) Ofer Lahav (University College London)
2MASS Galaxy Survey Publicly available eXtended Source Catalogue (XSC) J, H, K bands (Near Infrared) ~1,650,000 Galaxies with magnitudes corrected for Galactic extinction. Analysis includes 69% sky & 1,250,000 Galaxies Compare with Cabré et al. 2006 (SDSS DR4): ~16% (z ~ 1) Scranton et al. 2003 (SDSS – LRGs) : ~ 8% (z ~ 0.45) Fosalba and Gaztañaga 2003 (APM): ~10% (z ~ 0.15)
Auto-Correlation Cross-Correlation AoE statistic 2MASS ⊗ WMAP3
Constant linear bias b from Cgg(ℓ) 12 < K20 < 14
Auto-Correlation √ Cross-Correlation AoE statistic 2MASS ⊗ WMAP3
3rd Year WMAP Foreground reduced maps of Q,V and W bands Q band (41 GHz) V band (61 GHz) Images from WMAP Science Team W band (94 GHz)
Method: • Follow Afshordi et al. 2004 (WMAP1 ⊗ 2MASS) • Perform Cross-Correlation in Harmonic Space: • Cut Kp2 mask on WMAP3, Cut out 31% of 2MASS sky
WMAP3 / 2MASS Four Magnitude Shells ⊗ Q, V, W, ILC WMAP3 maps Achromatic Trend 1σ from 500 simulations of CMB with 2MASS
Changes between WMAP1 & WMAP3 ■ WMAP3 □ WMAP1 Why is there a difference?
Predicted Cross-Correlation: Exact & Small Angle Approximation: ℓ ~ 11
☼ Shells with z ~ 0.067 (>2.105gal) z ~ 0.084 (>4.105 gal) ∆χ2 = χ2ISW - χ2NULL= 2
Assume there is Dark Energy in a Ωk=0 Universe CgT [DATA] = h* CgT[ISW_fiducial] Without prior on σ8: h ~ 1.7 or 2σ detection (Null detection corresponds to h < 0) With prior on σ8: h ~ 1.6 Etc.. Full Parameter Space needs to be investigated Model Dependent Statistic
Auto-Correlation √ Cross-Correlation √ AoE statistic 2MASS ⊗ WMAP3
☼ WMAP3 Axis of Evil 2MASS ℓ=2 ℓ=3 ℓ=4 ℓ=5
WMAP3 ⊗ 2MASS : within 1σ [NULL] (Model Independent) ISW (fiducial) : within 1σ [NULL] CgTDATA ~ 1.7 CgTFIDUCIAL (Model Dependent 2σ Detection) AoE(WMAP) ≠ AoE(2MASS) Thanks to Filipe Abdalla, Niayesh Afshordi, Sarah Bridle, Carlo Contaldi, for comments, advice and assistance. Summary: 2MASS ⊗ WMAP3