Download
1 / 38
390 likes | 520 Views
1. Baryon Acoustic Oscillations Prospects of Measuring Dark Energy Equation of State with LAMOST. Xuelei Chen ( 陳學雷 ) National Astronomical Observatory of China. KIAS workshop 2008.10.28 Seoul. arxiv:0809.3002. 2. Xin Wang (NAOC) XC Fengquan Wu (NAOC) Zheng Zheng (IAS, Princeton)

E N D
1 Baryon Acoustic OscillationsProspects of Measuring Dark Energy Equation of State with LAMOST Xuelei Chen (陳學雷) National Astronomical Observatory of China KIAS workshop 2008.10.28 Seoul
arxiv:0809.3002 2 Xin Wang (NAOC) XC Fengquan Wu (NAOC) Zheng Zheng (IAS, Princeton) Pengjie Zhang (SHAO) Yongheng Zhao (NAOC)
3 photon and matter spectrum M. White 2007
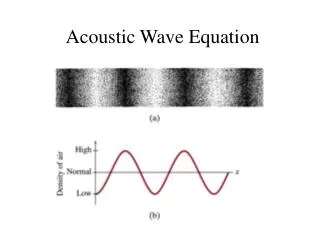
4 Sound Horizon and Peaks in power spectrum model spectrum Peaks at Blake & Glazebrook 2003
5 Standard Ruler for Cosmology
6 Combined constraints Percival et al 2007 DV(z=0.35)/DV(0.2)=1.812 +- 0.06
7 Large Aperture Multi-Optical fiber Spectroscopic Telescope (LAMOST) Located at Xinglong Station (117o 34' E, 40o 23' N)
LAMOST: A meridian reflecting Schmidt telescope • Main features • large aperture (4-meter) • wide field of view (5-degree) • observation only during the meridian transit (1.5-3 hours) of an object • observable sky -10o< dec <+90o ~24000 sqr. deg. • limiting magnitude (1.5hr) b=20.5 • 4000 fibers spectroscopy (3700A-9000A) • spectral resolution R=1000/2000 • total # of spectra (3yr) 107 • Technical innovations • active optics for segmented thin mirrors • parallel controllable fiber positioning
FoV (deg) Diameter (m)
Original Definition of Scientific Goals of LAMOST Wide field & large sample spectroscopy 107 galaxies Large scale structure of Universe, Cosmology Physics of galaxies 107 stars Galactic structure, Stellar physics 106 quasars… Multi-waveband astrophysics
Status and Plan: • Sep 2008, all hardwares in place • going through engineering tests • two workgroups appointed by the Survey Selection • Committee: extragalactic (Yipeng Jing), Milky Way (Licai • Deng); working for overall survey plans • Apr 2009, survey plans • Dec 2008 to 2009/10, commission period • 2010/11-2015, regular spectroscopic survey • data release (2 years after taken)
SDSS MAIN LAMOST MAIN Selecting Targets SDSS photometric catalog as input • generic galaxy survey • LRG survey • quasars SDSS region: about 8000 deg2
14 Selecting the Targets: Luminous Red Galaxies Luminous Red Galaxies (LRG): bright elliptical galaxies strongly clustered many in clusters or groups easy to determine photometric z
15 Target Redshift Distribution main1: r<18.8 main2: r<19.8 LAMOST LRG(MegaZ)
16 To what precision can we measure? Seo & Eisenstein 2003:
17 Error Estimates
18 Design the survey: integration time point source (QSO) exponential (spiral galaxy) de Vaucouleurs (elliptical galaxy) assume sky background 20.5 in r and i.
19 Design the Survey: target surface density Fiber Surface Density: 200 Optimal for fiber positioning: 400-600
Survey ideas 20
21 Estimate of the Bias of the sample
22 Estimate Bias Using the HOD model:
LRG bias We assume the HOD parameters given in Brown et al., arxiv:0804.2293 B band vs. other band: we assume matching density b(z=0.475)=1.77, b(z=0.625)=2.29
QSO bias Wyithe & Loeb (2003), Marulli et al (2006) QSO is triggered by major merger
QSO bias QSO1: g<20.5, QSO2: g<21.0, QSO3: g<21.65
Comparison with direct observation Porciani et al (2004) use 14000 quasar from 2dF/6dF to measure QSO bias The bias obtained this way is slightly (10%-20%) greater.
29 Effective Volume
30 Error on power spectrum
Error on distance scales Caution: error depends on bin size.
33 Improvement on Dark Energy EoS
35 Effect of Spectral Resolution on Figure of Merit (inverse of error ellipse area) SDSS: FoM~2
36 Simulation SDSS LAMOST
37 Summary • A main survey of 1-2 magnitude deeper than SDSS could improve BAO measurement FoM by a factor of about 3-5. • LRG survey fiber time is much smaller than MAIN1 but could achieve similar effective volume • QSO survey could achieve large effective volume at large scales, but declines rapidly at small scales • For BAO measurement, R=1000 is sufficient and economical • May improve current DE constraint, but still not enough to give accurate answer on varying EoS.
38 Thanks