Download
1 / 17
170 likes | 242 Views
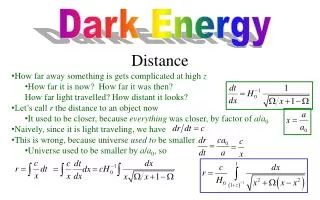
Explore how baryonic acoustic oscillations can test dark energy through the comoving sound horizon and BAO wavelength variations. Learn about constraining evolving BAO scales in cosmological models.

E N D
Using Baryon Acoustic Oscillationsto test Dark Energy Will Percival The University of Portsmouth (including work as part of 2dFGRS and SDSS collaborations)
Baryon Acoustic Oscillations Image credit: Martin White “Wavelength” of baryonic acoustic oscillations is determined by the comoving sound horizon at recombination varying the baryon fraction At early times can ignore dark energy, so comoving sound horizon is given by Gives the comoving sound horizon ~110h-1Mpc, and BAO wavelength 0.06hMpc-1 Sound speed cs
BAO as a standard ruler BAO position (in a redshift slice) therefore constrains some multiple of Changes in cosmological model alter measured BAO scale (∆dcomov) by: Radial direction (evolution of Universe) Angular direction (line of sight) If we are considering radial and angular directions using randomly placed galaxy pairs, we constrain (to 1st order) Varying rs/DV
Extracting BAO from P(k) fit data with a 2-component model comprising a smooth spline (node separation 0.05hMpc-1), and the sinusoidal (in the transfer function) multiplicative BAO component usually applied to a CDM model. The ability of this model to fit linear CDM power spectra is good. Percival et al., 2007, astro-ph/0608635 & astro-ph/0705.3323
The SDSS DR5 sample Main sample galaxies Type-I LRGs Type-II LRGs After various selection cuts, the DR5 sample gives 51251 LRGs and 462791 main galaxies (factor ~2 larger than previously analysed)
BAO from all the SDSS DR5 galaxies Compared with WMAP 3-year best fit linear CDM cosmological model. N.B. not a fit to the data, but a prediction from WMAP. Interesting features: Overall P(k) shape Observed baryon acoustic oscillations (BAO) Percival et al., 2007, ApJ, 657, 645
Matter density from SDSS BAO When combined with, and marginalised over the WMAP 3-year peak position, For flat CDM cosmologies Percival et al., 2007, ApJ, 657, 51
Comparing CMB & BAO CMB SDSS GALAXIES CREDIT: WMAP & SDSS websites
Comparing BAO at different redshifts SDSS main galaxies + 2dFGRS SDSS LRGs Tell us more about the acceleration, rather than just that we need it! z=0.2 z=0.35 CREDIT: WMAP & SDSS websites
Combining the SDSS and 2dFGRS Work for astro-ph/0705.3323 in collaboration with: Shaun Cole, Dan Eisenstein, Bob Nichol, John Peacock, Adrian Pope, Alex Szalay
BAO from the 2dFGRS + SDSS BAO detected at low redshift 0<z<0.3 (effective redshift 0.2) BAO detected at high redshift 0.15<z<0.5 (effective redshift 0.35) BAO from combined sample (detected over the whole redshift range 0<z<0.5) Percival et al., 2007, MNRAS, astro-ph/0705.3323
Galaxy distances needed for analysis Galaxy redshifts need to be converted to distances before BAO can be measured Not a problem for small numbers of parameters, but time consuming for more Solve problem by parameterizing distance-redshift relation by smooth fit with small number of modes: can then be used to constrain multiple sets of models For SDSS+2dFGRS analysis, choose two modes at z=0.2 and z=0.35, for fit to DV This forms an intermediate link between the cosmological models to be tested and data
BAO distance scale constraints Constraint including observed peak distance constrain from CMB rs/dA(cmb)=0.0104 CDM OCDM SCDM Constraint fitting rs/DV(z) Constraint from DV(0.35)/DV(0.2)
Cosmological constraints Consider two simple models: • CDM • Flat, constant w Constraint fitting rs/DV Constraint including distance to CMB Constraint from DV(0.35)/DV(0.2)
Cosmological constraints with SNLS • Consider two simple models: • Lambda-CDM • Flat, constant w
Discrepancy with CDM? LRG BAO on too small scales: further away than expected, so more acceleration between z=0.2 and 0.35 Discrepancy is 2.4 Can increase BAO damping and reduce significance of result, but then match with data becomes worse
conclusions • BAO offer an attractive method for DE studies • Good reasons to believe that systematics are of low amplitude • Physics is well known and can be modeled today • SDSS+2dFGRS measures BAO and rs/DV at z=0.2, z=0.35 • Constraint DV(0.35)/DV(0.2) = 1.812 is higher than predicted by LambdaCDM+WMAP+SNLS DV(0.35)/DV(0.2) = 1.67 (2.4 discrepancy). Needs more acceleration at low redshift • But, can reduce significance slightly by adjusting BAO fit • Many future BAO experiments are planned • BOSS, DES, PanSTARRS, WFMOS, ADEPT, SPACE, HetDEX, SKA, …