Comprehensive Guide to Data Collection and Sampling Techniques
Learn efficient procedures and strategies for collecting quantitative data by identifying populations, obtaining permissions, selecting participants, and recording data systematically. Explore various sampling methods and their importance in research design.


Comprehensive Guide to Data Collection and Sampling Techniques
E N D
Presentation Transcript
Data Collection Population Sampling
Comments on literature summary • Chapters 1, 2, 3,4 are not yours • Strong remark • Use of phrases from another article • Citing secondary sources • Block quotation and Page reference • In text citation • Colloquial – “In my opinion….” • Connecting ideas – on the other hand, moreover, in support of, This is supported by.., in contrast to, in addition, nonetheless….
Literature review Observation Background survey Broad area of research Theoretical framework Hypothesis generation Variables clearly identified Problem definition Research design Problem statement Research questions Methods Data collection Analysis Interpretation Deduction Hypothesis substantiated? RQ answered? Where we are now…
Lesson Objectives • Describe procedures • Obtaining permissions for data collection • Selecting participants for data collection • Identifying data options • Recording and administering data collection
Let’s move on to data collection What is data? Collection of facts from which conclusions may be drawn
Key ideas • Who will you study (unit, sampling, sample size)? • What permissions will you need? (levels,MOE) • What information will you collect? (types of data, links to questions/variables) • What instrument(s) will you use? (selecting an instrument, scales of measurement, validity, reliability) • How will you administer the data collection? (standardization, ethical issues)
Who will you study? • Unit of analysis is the level (e.g. individual, family, school, school district) the data will be gathered. • There may be different units of analysis • one for the dependent variable • one for the independent variable
Procedures for Collecting Quantitative Data (1) Obtain permissions • secure permissions • obtain informed consent from participants
Obtaining Permissions • Institutional or organizational (e.g. school district) • Site-specific (e.g. secondary school) • Individual participants or parents • Campus approval (e.g. university or college)
Obtaining Informed Consent from EPRD,MOE • Obtain Approval via State Education Department • Have participants sign an informed consent form
Procedures for Collecting Quantitative Data (2) Select participants • specify a population and sample • use probability and non-probability sampling • choose a sample size
Procedures for Collecting Quantitative Data (3) Identify data options • specify variables • operationalize variables • select scales of measurement • choose types of data measures
Procedures for Collecting Quantitative Data (4) Record and administer data collection • locate or develop an instrument • obtain reliable and valid data • develop administrative procedures for data collection
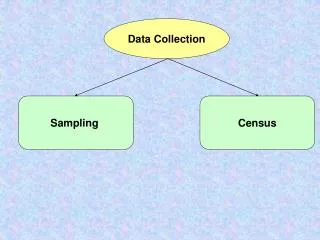
POPULATION and SAMPLING • A population is a group of individuals that comprise the same characteristics • A sample is a sub-group of the target population that the researcher plans to study
Select Participants: Specify a Population and Sample • Samples • for the purpose about making generalizations about the target population (quantitative research). • samples are only estimates • the difference between the sample estimate and the true population is the “sampling error.”
Populations and Samples Target Population Sample Sample Sample • Population • All science teachers in secondary schools in Kuantan • College students in all community colleges • Adult educators in all faculties of education All sec. school biology teachers in Kuantan Students in one community college Adult educators in 2 faculties of education in the East Malaysia
Probability and Non-Probability Sampling • Probability sampling is the selection of individuals from the population so that they are representative of the population • Non-probability sampling is the selection of participants because they are available, convenient, or represent some characteristic the investigator wants to study.
Types of Sampling Sampling Strategies Probability/Random Sampling Non-Probability/Purposeful Sampling Convenience Snowball Sampling Sampling Simple Stratified Cluster Random Sampling Sampling Sampling
Random “Quantitative” Sampling Select Representative individuals To generalize from sample to population To make claims about the population To build/test “theories” that explain the population Purposeful “Qualitative” Sampling Select people/sites who can best help us understand our phenomenon To develop detailed understanding That might be “useful: information That might help people “learn” about the phenomenon That might give voice to “silenced” people Differences Between Random and Purposeful Sampling
Types of Probability Sampling • Simple Random: selecting a sample from the population so all in the population have an equal chance of being selected • Systematic: choosing every “nth” individual or site in the population until the desired sample size is achieved
Population (N=9000) Boys N=6000 .66 of pop. 200 Girls N=3000 .33 of pop 100 Sample = 300 Types of Probability Sampling • Stratified sampling: stratifying the population on a characteristic (e.g. gender), then sampling from each stratum.
Types of Probability Sampling • Cluster Sampling: • Selects groups, not individuals • All members in the groups have similar characteristics • Useful when the population is large or spread over a wide geographical area
Example: Cluster Sampling • Population : All primary school teachers in Klang valley (5000) • The desired sample : 400 • Cluster: School • No. of primary schools in Klang valley: 150 • Average number of teachers per school : 40 • Number of cluster : 400/ 40 • 10 out of 150 schools are randomly selected • All teachers in the selected schools make up the sample
Try one • You want to study the resilience of UiTM students. • Population? • Sampling?
Select Participants: Choose a Sample Size • Select a sample size as large as possible from the individuals available • Select a sufficient number of participants for the statistical tests you will use • Calculate the sample size using a sample size formula
Select Participants: Choose a Sample Size • A rough estimate: • 15 participants in each grp in an expt • 30 participants for a correlational study • 350 individuals for a survey study but depend of several factors
Calculating sample size • Krejcie and Morgan (1970)
EXAMPLE • Gender difference in vocational interest of post matriculation at UiTM • Independent variable: • Dependent variable: • Research Design: • Population: • Sample size: • Instrument:
EXAMPLE Gender difference in vocational interest of post matriculation at UiTM • Independent variable: Gender • Dependent variable: Vocational interest • Research Design: Survey • Population: Post matriculation students • Sample size: 350 • Instrument: Self developed
Calculating sample size • Use web calculator • http://www.raosoft.com/samplesize.html • http://survey.pearsonncs.com/sample-calc.htm
When Does Sampling Occur? Before Data Collection After Data Collection has started What is the intent? What is the intent? To develop many perspectives To describe what is “typical” to those unfamiliar with the case To describe some sub-group in depth To take advantage of whatever case unfolds To explore confirming or disconfirming cases Maximal Variation Sampling Homogenous Sampling Typical Sampling Opportunistic Sampling Confirming/ Disconfirming Sampling To describe particularly troublesome or enlightening cases To generate a theory or concept To locate people or sites to study Theory or Concept Sampling Extreme Case Sampling Snowball Sampling Types of Purposeful Sampling
One may sample.. • Maximal variation • Most hardworking/ Highest achiever • Lowest achiever • Extreme case • ??
Examples of Non-Probability Samples • Convenience Sampling: participants are selected because they are willing and available to be studied • Snowball Sampling: the researcher asks participants to identify other participants to become members of the sample.
Non Probability sampling example • Study delinquent behaviour during recess. • I selected 1 school out of 4 - Interviewed all 4 principals and toured all 4 schools. I chose school to which I was given most access with fewest restrictions. Also school that reported the widest variations in delinquent behaviour during recess (very high to virtually no display). • Then sampled different locations with camera to find most varied activity and least self-conscious/guarded behavior. Where? • Turned out to be behind the surau. • Later used snowball approach in choosing children to interview.
Identify the variable Operationally define the variable Locate data (measures, observations, documents with questions and scales) Collect data on instruments yielding numeric scores Flow of Activities in Collecting Data
Identify Data Options: Specify Variables • Independent Variables • Dependent Variables • Intervening • Moderating
Identify Data Options: Operationalize Variables • Operational Definition: The specification of how the variable will be defined and measured • typically based on the literature • often found in reports under “definition of terms” • Sometimes the researcher must construct it
Identify the variable Operationally define the variable Locate data (measures, observations, documents with questions and scales) Collect data on instruments yielding numeric scores Self-efficacy for learning from others Level of confidence that an individual can learn something by being taught by others 13 items on a self-efficacy attitudinal scale from Bergin (1989) Scores of each item ranged from 0-10 with 10 being “completely confident.” Flow of Activities in Collecting Data Flow of Activities Example
Identify the variable Operationally define the variable Locate data (measures, observations, documents with questions and scales) Collect data on instruments yielding numeric scores Learning motivation of adult learners Interest and level of engagement of an individual ----- items on a questionnaire developed Scores of each item ranged from 1-5 with 5 being “most interested” Flow of Activities in Collecting Data Flow of Activities Example
Identify Data Options: Select Scales of Measurement • Nominal (Categorical): categories that describe traits or characteristics • participants can check • Female Male • Ordinal: participants rank the order of a characteristic, trait or attribute
Identify Data Options: Select Scales of Measurement • Interval: provides “continuous” response possibilities to questions with assumed equal distance ; scale with no true zero • Discrete (SD ---------------------SA) • Metric (oC) • Ratio: a scale with a true zero and equal distances among units
Practice Identify the level of measurement
Age Religion Gender Income bracket Test scores CGPA Frequency of asking questions Time spent on task Level of acceptance (0 – never, 5 – all the time) Activity ( 0 –not active, 5 – very active) Measurement level? Ratio ? Nominal? Ordinal? Interval?