Download
1 / 48
540 likes | 1.3k Views
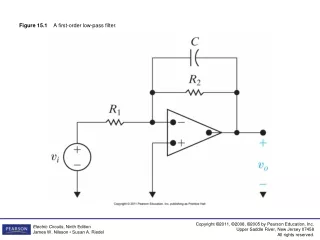
Figure 15.1 A first-order low-pass filter. Figure 15.2 A general op amp circuit. Figure 15.3 The Bode magnitude plot of the low-pass filter from Example 15.1. Figure 15.4 A first-order high-pass filter.

E N D
Figure 15.3 The Bode magnitude plot of the low-pass filter from Example 15.1.
Figure 15.5 The Bode magnitude plot of the high-pass filter for Example 15.2.
Figure 15.8 The Bode magnitude plot of the low-pass filter from Example 15.4.
Figure 15.9 Constructing the Bode magnitude plot of a bandpass filter.
Figure 15.10 A cascaded op amp bandpass filter. (a) The block diagram. (b) The circuit.
Figure 15.11 The cascaded op amp bandpass filter designed in Example 15.5.
Figure 15.12 Constructing the Bode magnitude plot of a bandreject filter.
Figure 15.13 A parallel op amp bandreject filter. (a) The block diagram. (b) The circuit.
Figure 15.14 The Bode magnitude plot for the circuit to be designed in Example 15.6.
Figure 15.15 The resulting bandreject filter circuit designed in Example 15.6.
Figure 15.16 The Bode magnitude plot of a cascade of identical prototype first-order filters.
Figure 15.17 A cascade of identical unity-gain low-pass filters. (a) The block diagram. (b) The circuit.
Figure 15.18 The cascade circuit for the fourth-order low-pass filter designed in Example 15.7.
Figure 15.19 The Bode magnitude plot for the fourth-order low-pass filter designed in Example 15.7.
Figure 15.20 A cascade of first- and second-order circuits with the indicated transfer functions yielding a fifth-order low-pass Butterworth filter with c = 1 rad/s.
Figure 15.21 A circuit that provides the second-order transfer function for the Butterworth filter cascade.
Figure 15.22 A fourth-order Butterworth filter with non-unity gain.
Figure 15.23 A comparison of the magnitude responses for a fourth-order low-pass filter using the identical cascade and Butterworth designs.
Figure 15.24 Defining the transition region for a low-pass filter.
Figure 15.25 A second-order Butterworth high-pass filter circuit.
Figure 15.27 The high-Qbandpass filter designed in Example 15.12.
Figure 15.28 The Bode magnitude plot for the high-Qbandpass filter designed in Example 15.12.
Figure 15.30 The high-Q active bandreject filter designed in Example 15.13.
Figure 15.31 The Bode magnitude plot for the high-Qactive bandreject filter designed in Example 15.13.
Figure 15.32 (a) Bass volume control circuit; (b) Bass volume control circuit frequency response.
Figure 15.33 The s-domain circuit for the bass volume control. Note that determines the potentiometer setting, so 0 1.