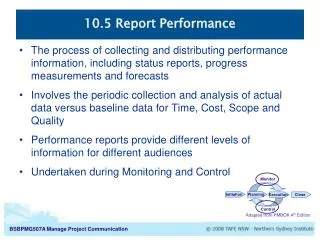
Performance Report
Performance Report. Student Managed Fund MBA class of 2005 April 22, 2005. Christophe Pane Luis Prandini Stephen Petretto Igor Lemagic Rajiv Iyer. MBA Fund Managers. Jie Wan Ashley Martella Yun Cai Amit Kumar Sampita Ray Gabriel Joanes.


Performance Report
E N D
Presentation Transcript
Performance Report Student Managed FundMBA class of 2005April 22, 2005
Christophe Pane Luis Prandini Stephen Petretto Igor Lemagic Rajiv Iyer MBA Fund Managers • Jie Wan • Ashley Martella • Yun Cai • Amit Kumar • Sampita Ray • Gabriel Joanes
Performance Highlights (Sept 24,2004 thru April 15,2005) *An additional $500,000 was added to the portfolio as of Jan,19 2005. **Based on risk-free rate of 4.23%.
Agenda • Economic Review • Investment Philosophy & Methodology • Portfolio Performance & Attribution Analysis • Lessons
Economic Review IMF Global Outlook 2005 • The global economy should continue to expand at a brisk pace in 2005, but has become too reliant on demand in the U.S. and is increasingly vulnerable to damage from high oil prices. • The global economic growth this year to be 4.3%, down from 5.1% in 2004. For 2006, the IMF predicted output would rise 4.4%. • Oil prices would average $46.50 a barrel for 2005, up 23.2% from the prior year, and $43.75 in 2006. • U.S. growth to 3.6% for both 2005 and 2006, an increase of 0.1 percentage point for both years. • Possibility of a jump in U.S. interest rates and a drop in U.S. consumption, sparked either by inflation fears or an abrupt reversal of foreign capital flows to the U.S. • The U.S. current account deficit - 5.7% of GDP in 2004 - probably won't improve much over the next couple of years, despite dollar depreciation.
Economic Review U.S. Last Two Week • The sudden shift in mood and economic outlook – the market is riskier than thought. • The Dow Jones Industrial Average last week recorded its steepest decline since 2003, dropping 3.6%. • Investors finally seem to believe that high crude oil and gasoline prices are curtailing consumer spending, slowing economic growth and cutting into corporate earnings. • Recent economic reports from the U.S. government portrayed sluggish job growth, weaker retail sales and a widening trade deficit only exacerbated by slowing American exports. • Fed policy makers at their last meeting talked of solid economic conditions and feared that overstimulated growth could stoke inflation. • The dollar rose in Europe as Asian stock markets slumped on signs of slower global growth.
Investment Philosophy • Benchmark: S&P500 Index • Long-term (3-5 year) investment horizon • Fundamental analysis • Business models • Historical performance • Future Prospects • Valuation models
Investment Strategy and Style • Top Down Approach • Blend Strategy • Combination of value and growth • Multi-Cap Fund Market Capitalization Small Caps 1 stock Large Caps 23 stocks Mid Caps 5 stocks • Primarily investments in large-cap stocks Number of holdings as of 02/25/05: 29
Investment Methodology Top Down Approach Sector Allocation Stock Selection • Valuation Models • PEG and P/E Models • Dividend Discount Model • Free Cash Flow Model • Fundamental Analysis • Business Model Analysis • Ratio Analysis • Future Prospects
Management Style • Active Management • Report presentation and voting • Performance Monitoring • Stop Loss Measures (15%) • Appreciation Reevaluation (20%) • Continuous Monitoring & Dynamic Response
Sector Allocation (as of 04/15/2005) Top 5 sectors: Financials Industrials Consumer Disc. IT Health Care
Detailed Sector Allocation (as of 04/15/2005) * Best Performer until 02/11
Performance Highlights (Sept 24,2004 thru April 15,2005) *An additional $500,000 was added to the portfolio as of Jan,19 2005. **Based on risk-free rate of 4.23%.
Portfolio Performance Attribution Period: September 24, 2004 to April 15, 2005
Performance Comparison – Phased(Sept 24,2004 thru April 15,2005) *An additional $500,000 was added to the portfolio as of Jan,19 2005.
Performance Comparison – Phased(Sept 24,2004 thru April 15,2005) *An additional $500,000 was added to the portfolio as of Jan,19 2005. Alpha 3.38% Alpha 4.67% Alpha 0.25%
Performance - Last Six Weeks • Outperformed during upturn • Slightly underperformed during downturn
Sector Allocation - Last Six Weeks • Energy and consumer discretionary took a hit amidst concerns of economic instability and falling crude oil prices • Beta in last six weeks > 1. Averages to 1 over a longer period of time
Lessons Learned and Takeaways • Stop losses can sometimes work against you • PFE, CACI • Have patience • Market tends to overreact when it incorporates new information • VLO • Stick with your strategy and convictions • Don’t get emotional about stocks • Teamwork • Don’t forget Qualitative factors and be careful with assumptions
Lessons learned and Takeaways (cont) • Know what drives the stock • Masco, Fedex • Accept the unexpected • Pfizer, Lion’s Gate • Enjoy the opportunity while it lasts!
Thank you. • University of Connecticut Foundation Inc. • Investment Advisory Board • Dr. Chinmoy Ghosh