Download
1 / 4
50 likes | 273 Views
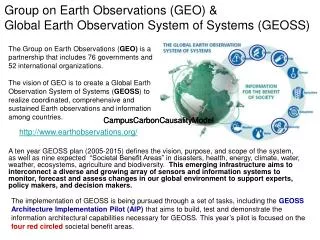
Group on Earth Observations (GEO) & Global Earth Observation System of Systems (GEOSS). The Group on Earth Observations ( GEO) is a partnership that includes 76 governments and 52 international organizations.

E N D
Group on Earth Observations (GEO) &Global Earth Observation System of Systems (GEOSS) The Group on Earth Observations (GEO) is a partnership that includes 76 governments and 52 international organizations. The vision of GEO is to create a Global Earth Observation System of Systems (GEOSS) to realize coordinated, comprehensive and sustained Earth observations and information among countries. CampusCarbonCausalityModel CampusCarbonCausalityModel http://www.earthobservations.org/ A ten year GEOSS plan (2005-2015) defines the vision, purpose, and scope of the system, as well as nine expected “Societal Benefit Areas” in disasters, health, energy, climate, water, weather, ecosystems, agriculture and biodiversity. This emerging infrastructure aims to interconnect a diverse and growing array of sensors and information systems to monitor, forecast and assess changes in our global environment to support experts, policy makers, and decision makers. The implementation of GEOSS is being pursued through a set of tasks, including the GEOSS Architecture Implementation Pilot (AIP) that aims to build, test and demonstrate the information architectural capabilities necessary for GEOSS. This year’s pilot is focused on the four red circled societal benefit areas.
Note: diagram only depicts finding and registering activities - no binding (yet) Evolving Architecture AQ Community Infrastructure Users Service Providers Community Portal find Search Register ESA/FAO register shared content ESRI GetCap. to ISO XSLT Compusult Web Form for other ISO Query via CSW KML to ISO XSLT USGS search Query via REST ISO to ISO XSLT Compusult Data Spaces ESRI ISO 19115 Community Catalog Z39.50 ISO WAF DRAFT presently testing CS/W 2.0.2 under development future development
Linear Causality Model for Campus Carbon Emissions Carbon/BTU Fuel Cons.BTU/yr C EmissionTon C/yr $/Student Sq. Ft./$ BTU/Sq.Ft. • The carbon impact of on-campus energy is due to direct fuel consumption and indirectly from electricity use • The overall carbon impact for on campus energy consumption has increased 50% from 1990-2007 • Electricity use contributed about 80 percent to the on-campus carbon impact PopulationStudents Activities$ Expend./yr Buildings Sq. Ft Kw-hr/Sq.Ft. Electr. ConsKw-Hr/yr Fuel Cons. BTU/yr C Emission Ton C/yr BTU/Kw-hr Carbon/BTU
Washington University Transportation Sector - Overview Fuels (FM), j Emission (EM), k Activity PMT VMT Sai=1 Fraction of PMT bi VMT/PMT cij Fuel/VMT djk Emission/Fuel- Car Car SUV/Truck SUV/Truck On Campus Trspt distance # of trips Bus Bus Gas Shuttles Shuttles Students Diesel Commutingdistance # of trips Carbon Faculty Metro Metro Electric Staff Walk/Bike Walk/Bike Unv. Mng Traveldistance # of trips Jet Fuel Train Train Air Air