TABLE
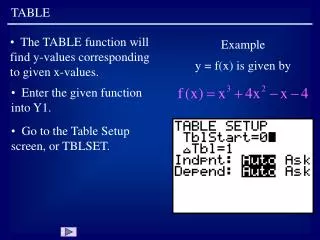
Example. y = f(x) is given by. TABLE. The TABLE function will find y-values corresponding to given x-values. Enter the given function into Y1. . Go to the Table Setup screen, or TBLSET. . Example. y = f(x) is given by. TABLE.

TABLE
E N D
Presentation Transcript
Example y = f(x) is given by TABLE • The TABLE function will find y-values corresponding to given x-values. • Enter the given function into Y1. • Go to the Table Setup screen, or TBLSET.
Example y = f(x) is given by TABLE • For TblStart (table start), enter the smallest x-value for which you would like to find the corresponding y-value. In this case, enter zero, if not already shown. • For Tbl (change in table), enter the increment for the x-values. In this case, enter one, if not already shown. Slide 2
Example y = f(x) is given by TABLE • Set both Indpnt (independent variable) and Depend (dependent variable) to “Auto”, if not already shown. To do this, arrow down to the appropriate line, with the blinking cursor on Auto, and press ENTER. • Go to TABLE. Slide 3
TABLE • Note the following: (1) In the x-column of the table, the first value is 0 ... which corresponds to the TblStart value in setup. (2) The values in the x-column are in increments of 1 ... which corresponds to the Tbl value in setup. Slide 4
This corresponds to the evaluation of the original function at x = 0. TABLE (3) Several y-values are given in the Y1 column ... in response to Auto in setup. (4) In the first row of the table, Y1 = -4 when x = 0. Slide 5
The function evaluated at x = 3 is ... TABLE (5) The fourth row shows a y-value of 56 corresponding to an x-value of 3. (6) The first row of the table yields the ordered pair (0,-4) on the graph of f, the second row corresponds to the point (1,0) on the graph of f, etc. Slide 6
TABLE (7) Pressing the up arrow five times results in the following screen. Pressing the up and down arrows cause the values in the x-column to increase or decrease by one. It is also possible to hold down either arrow key and watch the table scroll. Slide 7
TABLE • Now go back to TBLSET and change TblStart to 0 and Tbl to 2. • Go to TABLE. • Note that the values in the x-column are in increments of 2 this time. • In TBLSET make the following changes. Slide 8
TABLE • Then go to TABLE. • The start value for x is now -10, while the increments in x are 10 Slide 9
Example Find f(0), f(-10), and f(22): TABLE • Sometimes only a few evaluations are needed, or the x-values are far apart. In these cases it is easier to use the “Ask” function on the independent variable. • Go to TBLSET and arrow down to the Ask in the Indpnt row, and press ENTER. Slide 10
Example Find f(0), f(-10), and f(22): TABLE • No changes need to be made to TblStart or Tbl, since the table in Ask mode is not affected by their values. • Go to TABLE. • If there are entries in the x-column on your calculator screen, press the delete key DEL several times until the column is blank. Slide 11
Example Find f(0), f(-10), and f(22): TABLE • Now enter the three desired values, x = 0, -10, 22, pressing ENTER after each. • The corresponding function values are given. Try entering x = 100. • The function value is given in scientific notation. Arrow over to the function value to see the exact value on the bottom of the screen. Slide 12
TABLE • TABLE can be very helpful in comparing function values of several functions. • Let functions f and g be given by the following: • Enter the given functions into Y1 and Y2. Slide 13
TABLE • In TBLSET use the following settings. • Go to TABLE. • Note that function values for both f and g are given at the same time in the table. For example, f(3) = 56 while g(3) = 4. Slide 14