SNS Accumulator Ring Instability Damper and Beam Transfer Function Studies
550 likes | 790 Views
SNS Accumulator Ring Instability Damper and Beam Transfer Function Studies. Robert Hardin. Before I Begin… Many Thanks Go To:. Craig Deibele, Sasha Aleksandrov, Slava Danilov, Andy Webster, Jeff Bryan, Jim Diamond, George Link, Syd Murray III

SNS Accumulator Ring Instability Damper and Beam Transfer Function Studies
E N D
Presentation Transcript
SNS Accumulator Ring Instability Damper and Beam Transfer Function Studies Robert Hardin
Before I Begin… Many Thanks Go To: • Craig Deibele, Sasha Aleksandrov, Slava Danilov, Andy Webster, Jeff Bryan, Jim Diamond, George Link, Syd Murray III • You… For giving me the opportunity to be here today!
Overview • Introduction to the SNS facility • Motivation for a ring instability damper system • Basic elements of the analog system • Experimental damping result highlights • Fundamentals of beam transfer function measurements • Beam transfer function result highlights • Summary and Conclusions
The Spallation Neutron Source:is an accelerator-driven user facility for neutron scattering research at Oak Ridge National Laboratory in USA
Neutrons are used for research in: Biology & Medicine Biotechnology & Energy Fundamental Physics Imaging Magnetism Materials Nanotechnology Superconductivity Neutron Radiograph of an ancient Greek lamp www.ornl.gov
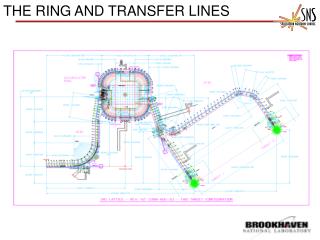
SNS Accelerator Complex <1 msec Chopper system makes gaps 945 ns mini-pulse Current Current 1 ms macropulse 1ms Collimators Accumulator Ring: Compress 1 msec long pulse to 700 nsec 1 GeV LINAC Front-End: Produce a 1-msec long, chopped, H- beam Injection Extraction RF 1000 MeV RTBT 2.5 MeV HEBT Front-End LINAC Liquid Hg Target 1 ms macropulse 1 ms
Baseline Beam Parameters P beam on target : 1.44MW (800 kW – 1MW) I beam average: 1.44mA Maximum Beam energy: 1 GeV(925 MeV) Duty factor: 6% Rep. rate: 60Hz Pulse width: 1ms
Proton beam follows a sinusoidal path In the real world… In a perfect world… Hill’s Eq. “Tune” describes the number of oscillations the beam completes per revolution Here the “Tune” is 6.2 .2 determines the phase advance of the beam around the ring
Motivation for the instability damper system at SNS As the proton beam accumulates in the ring, the beam can become unstable. Instability can produce losses in the beam, which reduces the power to targetand increases radiation in the ring.
Motivation for the instability damper system at SNS (2) Vacuum Wall electron Proton Beam Electron can be captured by the proton bunch “potential well” until bunch passes.
Motivation for the instability damper system at SNS (2.5) Electron freed via proton impact “Free (Lost) Proton” • Lost protons can cause electrons to be produced by impacting the chamber walls. • Electrons are accelerated/decelerated by the proton beam potential, with a net gain of energy. • Electrons cascade (secondary, tertiary, etc.) and can survive the gap between beam passages net gain of electrons. • With enough electrons, the protons can be shaken (not stirred) to produce an instability.
Motivation for the instability damper system at SNS (3) So why implement a ring feedback system? • Minimize or control instabilities in the ring • Reduce losses Better performance Higher beam intensities to target Ring Frequency = 1044389 Hz Mode ≈ Frequency
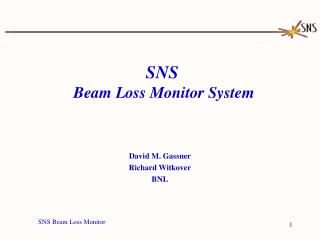
Beam Basic elements of the feedback system • Pickup (BPM Stripline) + Cable • Signal Processing (LLRF, Timing, Filtering) • RF Power Amplification • Kicker (BPM Stripline) + Cable Pickup Signal Processing Power Amplification Kicker Timing delay is crucial to maximize the damping… so that the 0.2 “Tune” produces a 90 degree phase advance between pickup and kicker
Ring damper system overview Consists of 2 independent systems Vertical (Up and Down) Horizontal (Left and Right) PA Stub LPF RF Switch Z3 PA Delay COMB Var. Atten SLP-300 Beam Pick Up Electrode Kicker Electrode
Damper System Fiber Optic Delays Horizontal Comb Filter Amplifier set Horizontal LLRF Power Combiners Vertical LLRF Vertical Comb Filter
Experimental Damping Results Damping ON (0 dB Atten.) Damping OFF
Damper has reduced the instability Damping OFF Damping ON (0 dB Atten.)
Growth rate of the active frequencies is reduced by ~ 60% Growth Rate (No Damping)~ 20 turns Growth Rate (With Damping) ~ 35 turns
Damper system is effective… • Continuously looking to improve the system • Maximizing the bandwidth (via equalizer) • Minimizing magnitude and phase dispersion in LLRF system • Maximizing signal output to Power Amplifiers • Utilize the damper system to supplement the physics group observations of the beam dynamics • Have been actively monitoring the beam during production and observed some unique dynamics (not discussed today). • Recently observed the beam may have an additional tune present, which limits the damping ability in the current configuration. • Employed the damper system in Beam Transfer Function measurements to observe the beam response to external excitation. (Next)
Introduction to Beam Transfer Function Measurements Kicker Electrode Pick Up Electrode PA Stub LPF RF Switch Z3 PA Pick Up Electrode Delay Delay COMB COMB Var. Atten Var. Atten SLP-300 SLP-300 Stub LPF Z3 NWA Kicker Electrode PA RF Switch PA Network Analyzer is used to excite the beam at a given frequency and observe the magnitude and phase of the response.
Stub LPF Z3 Pick Up Electrode NWA Kicker Electrode PA RF Switch PA Delay COMB Var. Atten SLP-300 Turns 0 to 136 beam NWA excitation Turn Window is determined by the Network Analyzer IFBW
Stub LPF Z3 Pick Up Electrode NWA Kicker Electrode PA RF Switch PA Delay COMB Var. Atten SLP-300 1601 Frequency Point Steps 1601 Macro Pulses ~ 30 sec @ 60 Hz for this measurement 1044389 Hz width (Ring Frequency)
Note: Only every 10th mode is shown here Typically others only make 1 or 2 of these measurements…
Mode = N*RF (N+1)*RF (N+2)*RF (N+6)*RF (N+3)*RF (N+4)*RF (N+5)*RF 1044389 Hz width (Ring Frequency) Make measurements into a more compact form.
Lower Side Band (LSB) Upper Side Band (USB) Betatron sidebands reveal the tune.
BTF Ring Tune Determination Fitting algorithm to determine the tune… Separate measurement gives the vertical tune ~ 0.1799 USB.. Pretty much a straight line… LSB on the other hand.. Currently no explanation
Additional information can be extracted from the BTF response measurements Determine the FWHM, assuming Gaussian function (NOT A FIT.. Just -6 dB points below peak) Convert to RMS
Vary the Chromaticity to determine capability of BTF measurement as a diagnostic *Coasting BTF theory defines the sideband frequency widths to be: • ∂f(+/-)= RMS Frequency width • f0 = Ring Frequency • dp/p = Momentum spread (DETERMINED FROM ZERO CHROMATICITY CASE) • m = Mode (VARIES) • Qf = Fractional Tune (VARIES) • = Chromaticity (VARIES) • = Slip Factor (-.2173) *Kornilov, et al., GSI-Acc-Note-2006-12-001 Zero Chromaticity
Frequency Width [Tune] Frequency Width [Tune]
Frequency Width [Tune] Frequency Width [Tune]
Chromaticity Measurement Results Tom’s Chromaticity measurements use the single mini-pulse injection into the ring method. (No RF Cavities on)
Currently we are unsure about the source of this effect. It could be due to the reduced signal acquisition time (7 kHz IFBW) which gives us the ability to only look at ~136 us of accumulation. If we were to reduce the IFBW, the expectation is that the minimal measurement resolution would improve, but at the cost of having to look at a longer portion of accumulation. (Under investigation)
One additional measurement… Typical Production ( = -6.9) Zero Chromaticity By changing the chromaticity to 0 (minimizing the tune spread) with the quadruples, the LSB response is essentially equal to that of the USB. This is due to reducing the Landau damping that naturally occurs with the natural chromaticity for the LSB.
Measurement of the Ring Tune and Chromaticity are successful (during early accumulation) • So far the data presented has focused on the very beginning of accumulation (Turns 1-136). • What happens when we shift our observation time to later in the accumulation cycle?
Turns 200 to 336 USB Splitting Begins
Turns 300 to 436 LSB Splitting Begins
Turns 600 to 736 Note: 720 Turns of Accumulation
What happens when we shift our observation time to later in the accumulation cycle? • During accumulation the beam dynamics become very complex. • To determine if the beam intensity was the root cause, experiments were performed by varying the number of pulses accumulated. • If the intensity is the primary cause it could lead to additional problems as SNS continues to increase toward the design goal as well as interfere with the ability to damp instabilities.
Comparing the Zero Chromaticity Intensity Variation Variation in beam intensity accounts for majority of BTF splitting. 100% Int 17% Int Turns 500 to 636 Turns 0 to 136
Summary and Conclusions • Feedback damper system is effective. • Continually trying to improve its effectiveness. • Beam Transfer Function measurements are a useful tool for monitoring beam dynamics and parameters. • Can be used as an additional physics diagnostic system to measure the tune and chromaticity. (Verified) • Illuminates unique dynamics that have not been observed before (to our knowledge).
Once Again… Many Thanks Go To: • Craig Deibele, Sasha Aleksandrov, Slava Danilov, Andy Webster, Jeff Bryan, Jim Diamond, George Link, Syd Murray III • You… For giving me the opportunity to be here today! Without them, none of this work would be possible!
Vertical Production (~815 kW to target) Damping On Damping Off
Horizontal Production (~815 kW to target) Damping On Damping Off
3.31E-04 = (dp/p)* dp/p = 1.52e-3