Download

1 / 22
320 likes | 608 Views
Sensitivity Analysis. Dr. Yan Liu Department of Biomedical, Industrial & Human Factors Engineering Wright State University. Introduction. Before Implementing a Decision, We Should Verify that numbers were entered correctly and calculations were performed properly

E N D
Sensitivity Analysis Dr. Yan Liu Department of Biomedical, Industrial & Human Factors Engineering Wright State University
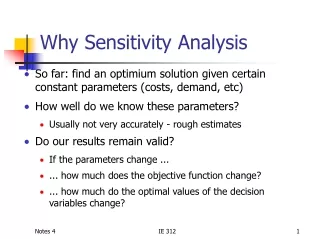
Introduction • Before Implementing a Decision, We Should • Verify that numbers were entered correctly and calculations were performed properly • Identify the specific assumptions behind the analysis • What is Sensitivity Analysis? • A systematic study of how the solution to a decision model changes as the assumptions are varied • Varying one, two, or all the parameters simultaneously • Also known as “what-if” analysis • “what would happen if …” • Importance of Sensitivity Analysis • Helps to obtain a fuller understanding of the dynamics of the decision problem • Whether the best decision strategy is robust • Helps to identify the important elements in the decision problem • To construct a requisite decision model
Introduction (Cont.) • Applications of Sensitivity Analysis • Problem identification level • Is this the right problem to solve? (the error of the 3rd kind: solving a wrong problem) • Problem structure level • Is there any piece of the puzzle missing? • How large is the impact of each variable? • How important is the uncertainty of a variable? • …
Eagle Airlines Case Dick Carothers, the president of Eagle Airlines, wants to expand his operation. Eagle airlines owns 3 aircrafts and provides 50% charter flights and 50% scheduled commuter service (only 90 min. of flying time on average). He has a news that a small airline in the Midwest is selling an airplane (Piper Senecca). • The owner of Senecca has offered: 1) sell the airplane outright at price $95K (Carothers could probably buy it for $85K ~ $90K) or 2) sell an option to purchase the airplane within a year at a specified price (the cost of the option is $2.5k ~ $4k). • The properties of the airplane: 1) new engines, FAA maintained; 2) contains all the needed equipment; 3) 5 seats; 4) operating cost: $245/hour; 5) fixed cost: $20k yearly insurance + finance charges • Finance charges: borrow 30-50% of the price at 2% above the prime rate (currently 9.5%, but subject to change) • Revenue: 1) charter flights at $300 - $350 per hour; 2) scheduled flights at around $100 per person per hour (planes are 50% full on average); 3) expect to fly the plane 800 ~1000 hours per year (50% charter flights) • Carothers can always invest his cash in the money market at 8% yearly interest rate • Variables in control: 1) the price he is willing to pay; 2) the amount financed • Variables not in control: 1) insurance cost; 2) operation cost
Decision Elements • Objectives Maximize profits • Profits = Revenue – Cost Revenue: • Revenue from charters = (charter flight ratio)*(hours flown)*(charter price) • Revenue from scheduled flights = (1-charter flight ratio)*(hours flown)*(ticket price)*(#seats)*(capacity of scheduled flights) Cost: • Fixed cost = insurance+Finance=insurance+(purchase price)*(% financed)* (interest rate) • Variable cost = (hours flown)*(operating cost/hour)
Decisions to Make and Alternatives • Purchase decision • 1) Purchase the airplane outright • 2) Purchase the airplane a year later with the option • 3) Put money in the money market • Proportion financed • Any amount between 30% and 50% • Charter price • Any amount between $300 and $350/hour • Ticket price for scheduled flights • Any amount between $95 and $108/hour
Uncertain Events (Relevant to the Decisions) • Charter flight ratio • Hours flown • Capacity of scheduled flights • Insurance • Purchase price • Interest rate • Operating cost/hour
Capacity on scheduled flights Hours flown Operating cost Charter flight ratio Insurance Charter Price Total Cost Revenue Purchase Price Profit Variable Cost Fixed Cost Scheduled flight revenue Finance Cost Charter Revenue Ticket Price Interest rate Profit Revenue Total Cost Proportion financed Purchase Seneca Influence Diagram Uncertainty
Ranges of Input Variables for Eagle Airlines Decision Variable Base Value Lower Bound Upper Bound Hours flown 500 1000 800 Charter price/hour $300 $350 $325 Ticket price/hour $95 $100 $108 60% Capacity of scheduled flights 50% 40% Ratio of charter flights 45% 70% 50% Operating cost/hour $245 $230 $260 Insurance $18,000 $25,000 $20,000 Proportion financed 0.30 0.50 0.40 Interest rate 10.5% 13% 11.5% Purchase price $85,000 $90,000 $87,500 Sensitivity Analysis
Profit Profit=$4,200 Hours flown = 664 h Hours Flown Purchase Seneca Money Market One-Way Sensitivity Analysis • Examine whether a variable really makes a difference in the decision by varying its value while keeping other variables at their base values (best guesses) Question: Under what condition is this procedure adequate? One-Way Sensitive Analysis of Hours Flown
Tornado Diagram • A bar (or line) is used to represent the range of payoffs due to the variation of an input variable • Allows us to compare one-way sensitive analyses for many input variables at once Capacity of scheduled flight Operating cost Hours flown Charter price Interest rate Purchase price Profits Money Market Tornado Diagram of Eagle Airlines Decision
Two-Way Sensitivity Analysis • Study the joint impact of changes in two variables In the Eagle Airlines example, suppose we want to conduct a two-way sensitivity analysis of the two most critical variables – capacity of the scheduled flights (CS) and operating cost (OC) • Set all the other input variables at their base values, yielding • Profit= $130,000+$200,000*CS-800*OC-$24,025 • If Profit < $4,200 (market value), then it is less profitable to purchase the airplane • If Profit > $4,200 (market value), then it is more profitable to purchase the airplane • Solve equation: Profit= $4,200 • $130,000+$200,000*CS-800*OC-$24,025= $4,200 • 800*OC – 200,000*CS = 101,775 (indifference line)
(indifference line) Two-way Sensitive Analysis of Eagle Airlines Decision
Sensitivity to Probabilities • Study the impact of uncertainties of events License Technology Patent Awarded $23M Continue Development Demands High (p=?) $43M (0.7) Develop Production and Marketing to Sell Product Demands Med. $21M (q=?) Development Result Demands Low $3M (1-p-q) No Patent Development Decision -$2M (0.3) Stop Development $0 Decision Tree of Research-and-Development Decision
License Technology Patent Awarded Continue Development $23M (0.7) Development Result No Patent -$2M Demands High Develop Production and Marketing to Sell Product Patent Awarded (p=?) $43M Continue Development Demands Med. $21M (q=?) (0.7) Demands Low $3M (1-p-q) Development Result No Patent -$2M Decision Strategies EMV(A)=$0 Strategy A: Stop development Strategy B: Continue development, license technology EMV(B) = 23*0.7+ (-2)*0.3 = $15.5M Strategy C: Continue development, develop production & marketing EMV(U1) =0.7*EMV(U2)+(-2)*0.3 U2 U1 EMV(U2) =43p+21q+3(1-p-q) EMV(C)=[43p+21q+3(1-p-q)] * 0.7 + (-2) * 0.3 = 28p+12.6q+1.5
p EMV(C) > EMV(B) p=0.5 EMV(C) = EMV(B) EMV(C) < EMV(B) p=0.05 q EMV(C) and EMV(B) are always greater than EMV(A), so only EMV(B) and EMV(C) need to be compared to find the best strategy EMV(C) = EMV(B) 28p + 12.6q = 14 (indifference line) Two-way Sensitive Analysis of Probabilities for Research-and-Development Decision
Exercise The town of Bedford is planning a celebration of honor its gold-metal-winning Olympic Cross-country skier. The celebration is set to be held in the town’s center for the day she returns. Unfortunately, the weather report predicts that the temperature might not be conducive to an outdoor event on that day. As a backup plan, they are thinking about reserving indoor space. However, that reservation would cost additional taxpayer’s money. Therefore, Julie Bauer, the town manager, needs to decide whether to reserve the indoor space. • Draw the decision tree of this decision • Suppose that the probability of a cold weather is estimated to be 40% and that holding the event is twice as important as saving taxpayer’s money, what would you suggest to Julie Bauer from the analyses of both the expected values and risk profiles? • Julie Bauer is also wondering how her decision would be affected by the probability of the cold weather and the tradeoff between the two objectives, so what would you tell her by performing a two-way sensitive analysis for the two parameters? (Hint: set the ratio of the weight of “holding event” to the weight of “saving money”, say k, as the parameter for tradeoff)
Save Money Event Held Cold No Yes Not Cold Reserve No Yes Cold No Yes Don’t Reserve Not Cold Yes Yes 1. Decision Tree
Overall Score Save Money Event Held Cold =100*2/3+0* 1/3=200/3 0 100 (0.4) Reserve =100*2/3+0* 1/3=200/3 0 100 (0.6) Cold 0 100 =0*2/3+100*1/3=100/3 Don’t Reserve (0.4) 100 100 =100*2/3+100*1/3=100 (0.6) 2. Let wh and ws denote the weight of holding the event and the weight of saving money, respectively. Because wh = 2ws and wh + ws = 1, solving the equations, we can get wh = 2/3, and ws = 1/3. Converting both attributes to 0 -100 scale, we can set “holding event” to 100, “canceling event” to 0, “saving money” to 100, and “costing money” to 0. Not Cold Not Cold
Reserve: EV(Reserve) = 0.4 • 200/3 + 0.6 • 200/3 = 200/3 Overall score: 200/3(100%) Don’t Reserve: EV(Don’t Reserve) = 0.4 • 100/3 + 0.6 • 100 = 220/3 Overall score: 100/3(40%), 100(60%) No strategy dominates the other Compared to the strategy of “reserving the indoor space”, the strategy of “not reserving the indoor space” has a slightly higher expected value of the overall score but is riskier as well. Cumulative Risk Profile (Draw the risk profiles on your own)
Overall Score Save Money Event Held Cold 100k/(k+1) 0 100 (p) Not Cold Reserve 0 100 100k/(k+1) (1-p) Cold 100/(k+1) 0 100 (p) Don’t Reserve 100 100 100 (1-p) 3. Assume wh = kws and wh + ws = 1, solving the equations, we can get wh = k/(k+1), and ws = 1/(k+1). Not Cold EV(Reserve) = 100k/(1+k) EV(Don’t Reserve) = p•100/(k+1) + 100•(1-p) EV(Reserve) = EV(Don’t Reserve) 100k/(1+k) = 100p/(k+1) + 100(1-p) k∙p=1 (indifference curve) When k∙p >1, EV(Reserve) > EV(Don’t Reserve), and when When k∙p <1, EV(Reserve) < EV(Don’t Reserve)
EV(Reserve) > EV(Don’t Reserve) EV(Reserve) = EV(Don’t Reserve) C EV(Reserve) < EV(Don’t Reserve) (p=0.4; k=2) Two-Way Sensitivity Analysis of the Probability of Cold Weather and Weight Ratio of the Two Attributes