Download
1 / 31
310 likes | 332 Views
The Standardized Infection Ratio. Linda R Greene, RN, MPS,CIC Rochester General Health System Rochester, NY l inda.greene@rochestergeneral.org. Objectives. Describe what the Standardized Infection Ratio (SIR) is and how it is calculated.

E N D
The Standardized Infection Ratio Linda R Greene, RN, MPS,CIC Rochester General Health System Rochester, NY linda.greene@rochestergeneral.org
Objectives • Describe what the Standardized Infection Ratio (SIR) is and how it is calculated. • Explain how to generate and interpret a report utilizing the SIR. • Identify uses for the SIR in public reporting • Explain the relationship between HAI rates and the SIR
Standardized Infection Ratio Method • Standardized Infection Ratio ( SIR) is a summary measure used to compare the HAI experience among one or more groups of patients to that of a standard population’s (e.g. NHSN) • Indirect standardization method- Comparison to a referent population
What is a standardized infection ratio (SIR)? • The standardized infection ratio (SIR) is a summary measure used to track HAIs at a national, state, or local level over time • The SIR adjusts for patients of varying risk within each facility • It is a summary statistic widely used in public health • In HAI data analysis, the SIR compares the actual number of HAIs reported with the baseline U.S. experience
I was just getting used to rates, why the SIR? More sensitive for low denominators Ability to combine data Useful for predicting state and national rates
OK , I’m no statistician what’s all this mumbo jumbo about? In simple terms- you are compared to the average of a referent population adjusted for risk. In this case it is a historical control. The SIR
Let’s take a closer look Hospital A :
Turned into SIR How do we get the expected ? Med Surg 2.1 /1000 x 865= 0.95 SICU 2.8 /1000 X 1000= 2.8 CTICU 1.1/1000 X 848= 0.93 MICU 2.1 / 1000 X1000= 2.1
The SIR SIR is less than 1
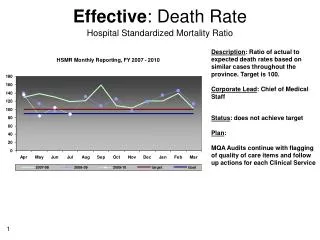
Simply Put • A SIR of 1.0 means the observed number of infections is equal to the number of expected infections. • A SIR above 1.0 means that the infection rate is higher than that found in the "standard population." For HAI reports, the standard population comes from data reported by the hundreds of U.S. hospitals that use the NHSN system. The difference above 1.0 is the percentage by which the infection rate exceeds that of the standard population. • A SIR below 1.0 means the infection rate is lower than that of the standard population. The difference below 1.0 is the percentage by which the infection rate is lower than that experienced by the standard population
Statistical Significance • If the P value is less than .05 then your rates are different than the national average • If the confidence level does not overlap 1, then your rates are different than the national average.
Calculation Observed ( number of Infections) Expected (expected number of infections)
Surgery data vs. CLABSI • Uses patient level data • Logistic regression modeling • Excludes superficial infections
Using data Locally Colon SSI per Month 2010- 2011
2010 SSI Expected and Observed SSI Number Of Infections