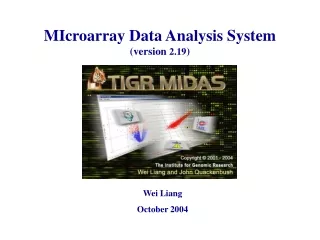
MIDAS: Microarray Data Analysis System
MIDAS is a data pre-processor tool for microarray analysis, offering normalization methods, quality control filtering, and significant gene identification to facilitate interpretation of gene expression data.

MIDAS: Microarray Data Analysis System
E N D
Presentation Transcript
MIcroarray Data Analysis System(version 2.19) Wei Liang October 2004
Printer Scanner Database AGED Database Others… Database MAD Microarray Data Flow .tiff Image File Image Analysis Raw Gene Expression Data Gene Annotation Normalization / Filtering Normalized Data with Gene Annotation Expression Analysis Data Entry / Management Interpretation of Analysis Results
MIDAS is a Normalization and Filteringtool for microarray data analysis!
MIDAS is a Normalization and Filteringtool for microarray data analysis! Serves as a data pre-processor for clustering analysis (MeV).
Cy3 Cy3-cDNA Cy5 Cy5-cDNA Systematic experimental error Uneven hybridization gel print-tip variations Background variations Wavelength dependent Intensity dependent Image processing algorithm-dependent Why Normalization and Filtering? .tiff Image Files Raw Data File Sample1 mRNA Cy3 intensity RT RT cDNA array Sample2 mRNA Cy5 intensity
Why Normalization and Filtering? • The hypothesis underlying microarray analysis is that the measured intensities for each arrayed gene represent its relative expression level. • We use these intensities to identify biologically relevant patterns of expression by comparing measured levels between states on a gene-by-gene basis. • However, before the levels can be appropriately compared, one generally performs a number of transformations on the data to eliminate questionable or low quality data, to adjust the measured intensities to facilitate comparisons, and to select those genes that are significantly differentially expressed.
MIDAS data analysis methods • 8 normalization/transformation methods Total Intensity normalization Ratio Statistics normalization LOWESS (Locfit) normalization Standard deviation regularization Iterative linear regression normalization In-slide replicates analysis Iterative log mean centering normalization MA-ANOVA • 10 quality control filtering methods Flip-dye consistency checking Low intensity filter Spot QC flag checking Ratio Statistics confidence interval checking Signal/Noise checking Invalid-intensity checking Cross-file-trim • 3 significant genes identification methods Slice analysis (non-statistical) Cross-slide replicates t-test (statistical) Cross-slide one-class SAM (statistical)
Graphical scripting language • Read input files • Define analysis pipeline and set parameters for each analysis module • Write output files
MIDAS data analysis methods • 8 normalization/transformation methods Total Intensity normalization Ratio Statistics normalization LOWESS (Locfit) normalization Standard deviation regularization Iterative linear regression normalization In-slide replicates analysis Iterative log mean centering normalization MA-ANOVA • 10 quality control filtering methods Flip-dye consistency checking Low intensity filter Spot QC flag checking Ratio Statistics confidence interval checking Signal/Noise checking Invalid-intensity checking Cross-file-trim • 3 significant genes identification methods Slice analysis (non-statistical) Cross-slide replicates t-test (statistical) Cross-slide one-class SAM (statistical)
LOWESS (Locfit) normalization A SD = 0.346 R-I plot: logRatio vs. logIntensityProduct • Observations • Tilted tails at low intensity end and high intensity end 2. Mean not centered at 0 – intensity dependent
LOWESS (Locfit) normalization A SD = 0.346 Gene X Exp factor Bio factor • If Cy3, Cy5 equally expressed, log2(Cy5/Cy3) = 0 • Two factors contributed to the up-regulated gene X: 1.Biological factors (we are interested) 2.Experimental factors, e.g. different sensitivity to red and green lasers (we are NOT interested and desire to get rid of.)
A SD = 0.346 We need to find a way to extract the experimental factors Approach: Assume similar experimental factors applied to genes closer to each other in the logProd-logRatio plot Predict the Exp factor from a group of locally neighboring data --- equivalent to a curve fitting problem. LOWESS (Locfit) normalization Gene X Exp factor Bio factor
LOWESS (Locfit) normalization A SD = 0.346 • Local linear regression model • Tri-cube weight function • Least Squares Estimated values of log2(Cy5/Cy3) as function of log10(Cy3*Cy5)
LOWESS (Locfit) normalization A SD = 0.346 Gene X y(xi) = Exp factor Bio factor Use the estimated curve y(xi) to correct raw data log2(Ri’/Gi’) = log2(Ri/Gi) – y(xi) log2(Ri’/Gi’) = log2(Ri/Gi) – log22y(xi) log2(Ri’/Gi’) = log2(Ri/Gi * 1/2y(xi)) Ri’ = Ri Gi’ = Gi * 2 y(xi)
LOWESS (Locfit) normalization B SD = 0.346 SD = 0.338 LOWESS-corrected RI plot
Standard deviation regularization Assumption: Within each block and each slide, spots should have the same spread for log(Cy5/Cy3, 2) values SD-Reg scales the (Cy3, Cy5) intensity pair for each spot so that the spot sets within each block or each slide will have the same standard deviation as other blocks or slides.
Standard deviation regularization • Let aijbe the raw log ratio for the jth spot in ith block (or slide) a’ij be the scaled log ratio for the jth spot in ith block (or slide) where Nj denotes the number of genes ith block or ithslide, M denotes the number of blocks or slides, aij denotes the log ratio mean of ith block (or ithslide)
Gene1 Gene2 Gene3 Gene4 Gene5 Gene6 Gene7 Gene8 G2 R2 G1 R1 Flip dye replicates consistency filter • Flip dye experiments help reduce random error • The intensities in the file pair are flipped, i.e. R1/G1 ~ G2/R2 or R1~ G2, G1 ~ R2
Flip dye replicates consistency filter • Calculate expression levels for all genes in the flip-dye pair • Filter genes with inconsistent expression levels between flip-dye replicates • For those genes passed the consistency checking, take geometric mean for the corresponding intensities from the replicated pairs How consistency is measured between replicates?
File 1 File 2 G1 R1 G2 R2 Gene Flip dye replicates consistency filter 100% consistency:
Flip dye replicates consistency Filter Regardless of datasets, always cut the same percentage for the same • SD cut vs. Threshold cut SD cut The percentage to cut depends on the specified log-ratio consistency range -1< < 1 Threshold cut 1/2 < < 2
Flip dye replicates consistency filter • Calculate expression levels for all genes in the flip-dye pair • Filter genes with inconsistent expression levels between flip-dye replicates • For those genes passed the consistency checking, take geometric mean for the corresponding intensities from the replicated pairs
Slice Analysis filter • Remove genes with z-scores beyond an interested range
Slice Analysis filter • Remove genes with z-scores beyond an interested range
Slice Analysis filter B SD = 0.346 SD = 0.338 • Define a slice window • Sliding the window along the log(IntensityProduct) axis • Calculate logRatioMean and logRatioSD of data points within each slice window • Calculate Z-scores of each data point Z-score = (logRatio-logRatioMean)/ logRatioSD • Trim data with Z-scores beyond interested range
Analysis packaging myAnalysis.prj
MIDAS graphing R-I plot (.prc) Intensity plot (.ity, .lty) FlipDye Diagnostic plot (.rrc) Z-score Distribution plot (.his) SAM plot (.sam) Box plot (.box)
Statistical significant genes identification methods Two methods implemented in this release of MIDAS: • Cross-slide replicates one-class T-test • Cross-slide replicates one-class SAM
SAM (Significance Analysis of Microarrays) A statistical technique for finding significant genes in a set of microarray experiments. Reference: Tusher, V.G., R. Tibshirani and G. Chu. 2001. Significance analysis of microarrays applied to the ionizing radiation response. Proceedings of the National Academy of Sciences USA 98: 5116-5121. Designs: • two-class unpaired • two-class paired • multi-class unpaired • censored survival • one-class (available in this release)
SAM (Significance Analysis of Microarrays) One-class SAM: Identify genes whose mean expression across experiments are different from a user-specified mean. • Assign a score (d) to each gene based on its change in expression relative to the standard deviation of repeated measurements for the gene • Genes with scores > a threshold (Δ) are deemed potentially significant • For these “deemed potentially significant” genes, the proportion of them likely to have been wrongly identified by chance, or False Discovery Rate (FDR) is estimated • The goal is picking a set of differentially expressed genes with a user-satisfied FDR
SAM (Significance Analysis of Microarrays) positively significant genes FDR Δ adjustment
TM4 MIDAS web page http://www.tigr.org/software/tm4/midas.html http://www.tm4.org/midas.html