Download
1 / 43
430 likes | 614 Views
DAVID slides May 2014 version 5. Appendix Edited and expanded subset of slides on DAVID * (NIAID) from the class:.

E N D
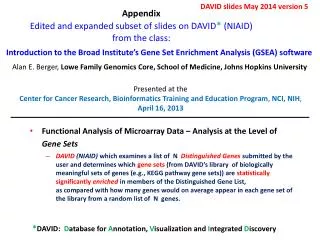
DAVID slides May 2014 version 5 Appendix Edited and expanded subset of slides on DAVID* (NIAID) from the class: • Functional Analysis of Microarray Data – Analysis at the Level of Gene Sets • DAVID (NIAID) which examines a list of N Distinguished Genes submitted by the user and determines which gene sets (from DAVID’s library of biologically meaningful sets of genes (e.g., KEGG pathway gene sets)) are statistically significantly enrichedin members of the Distinguished Gene List, as compared with how many genes would on average appear in each gene set of the library from a random list of N genes. Introduction to the Broad Institute’s Gene Set Enrichment Analysis (GSEA) software Alan E. Berger, Lowe Family Genomics Core, School of Medicine, Johns Hopkins University Presented at the Center for Cancer Research, Bioinformatics Training and Education Program, NCI, NIH, April 16, 2013 *DAVID: Database for Annotation, Visualization and Integrated Discovery
Background • Genome-wide expression profiling with microarrays and RNA Sequencing has become an effective frequently used technique in molecular biology • Interpreting the results to gain insights into biological mechanisms remains a major challenge • For a typical two group comparison, e.g., tumor vs. normal or “treated” vs. control, a standard approach has been to produce a list of differentially expressed genes (DEGs) • One also might obtain a list of “Distinguished Genes” from examining correlation of gene expression with a pertinent clinical variable
Typical Criteria for Differential Expression of a Gene g Between Groups (note statistical analysis is done for each probe; a gene is considered differentially expressed if one or more of the probes for the gene passes the criteria for differential expression) • Statistically significant differential expression • by t-test, multi-way ANOVA, etc. • P-value cut-off: require, e.g., p ≤ 0.01 (but see the FDR requirement which will in practice impose a more stringent condition on the p-value) • Satisfactory false discovery rate (FDR) • What fraction of the DEG list is false positives? • Benjamini-Hochberg procedure for estimating the FDR is a common choice (e.g., require FDR ≤ 0.1 but 0.2 or 0.25 is quite satisfactory for use in determining a gene list for DAVID). • Sufficient level of fold change (FC) • require |FC| ≥ 1.5 or 2 (common convention: groups A, B, gene g with average expression levels A, B; FC A /B when A ≥ B; FC -B /A when B > A ; user gets to pick which of their two groups is treated as A and which as B)
DEG lists II • Large fraction of “Present” calls for the expression values in the group with the higher average expression level for that probe • 80% but require 3 out of 3 when group size = 3 • If this is not satisfied for a given probe, do not do any statistical testing on it. • This avoids false positives based on noise, and also reduces the number of comparisons used in calculating the FDR. • Specific criteria and cutoffs depend on user preference and the biological situation (e.g., would like “sufficient amount” of mRNA present and |FC| ≥ 2 for qRT-PCR verification) • Often simply give DAVID a list of genes that satisfy a given fold change condition (FC ≥ 2 or FC ≥ 3 or FC ≤ -2 or FC ≤ -3; submit upregulated in group A, down-regulated in group A (i.e., upregulated in group B) gene lists separately). A “nice, manageable ” list size for DAVID is roughly 100 to 400 genes but we have obtained useful results from DAVID with lists of size on the order of 50 to 2000 genes. Small lists have less statistical power while large lists might potentially attenuate the “signal” from a small group of biologically significant genes occurring toward the top of a ranked list of genes.
Challenges in Interpreting Gene Microarray Data • Even with DEG list(s) of up and/or down-regulated genes, still need to accurately extract valid biological inferences. Cutoff for inclusion in DEG lists is somewhat arbitrary. • May obtain a long list of statistically significant genes without any obvious unifying biological theme • May have few individual genes meeting the threshold for statistical significance • Remember statistical significance and biological significance are not the same; e.g., a drug might produce a statistically significant reduction in blood pressure (the effect is “real”) but the amount of the reduction (the effect size) might not be large enough to be medically useful. If the sample sizes are large enough one may have the statistical power to confirm small real effects which are not necessarily biologically important.
Enrichment of Gene Categories in a Gene List • Statistical procedures such as Fisher’s exact test based on the hypergeometric distribution are used to test if members of a list of “distinguished genes” (e.g., genes found to be differentially expressed between 2 groups or with large fold changes: submit upregulated and downregulated gene lists separately) are overrepresented in given Gene Ontology (GO) categories or in predefined gene sets (see next slide) compared with the distribution of the whole set of genes represented on the chip. • Many tools have been developed along this line including: DAVID (whose use we will describe in considerable detail in the slides that follow), GoMinor, GenMAPP, Onto-Express, Gostat, GATHER. • But note that Gene Set methods can only report enrichment or differences in aggregate expression for gene sets that are already in the library of gene sets being examined.
14 Annotation Categories Used in DAVID Functional Classification Tool From supplementary material (Additional Data File 7) of: The DAVID Gene Functional Classification Tool: a novel biological module-centric algorithm to functionally analyze large gene lists Da W Huang, Brad T Sherman, QinaTan, Jack R Collins, W Gregory Alvord, Jean Roayaei, Robert Stephens, Michael W Baseler, H Clifford Laneand Richard A Lempicki Genome Biology 2007, 8:R183 doi:10.1186/gb-2007-8-9-r183 Published: 4 September 2007
The Underlying Idea Behind the Statistics inside DAVID In this example 1% of the total (10000) genes are in the pathway S. There are 50 genes in the DEG list. One would expect on average to have 0.5 genes of a random list of 50 genes being in the pathway S. In this illustration there are actually 5 genes from the DEG list in S. The hypergeometric distribution provides the p-value for this event (the probability that by chance one would have this many (5) or more genes of a randomly chosen list of 50 genes being in the pathway S). Fisher Exact Viewpoint: 2 X 2 Contingency Table One way to view this is think of there being 10,000 candies (genes) in a bin (array), 100 of which are Ghirardelli chocolates (in the pathway S), and being given a random batch of 50 candies from the bin (a random DEG list). If you got 5 or more of the chocolates, were you unusually lucky? Indeed yes! (P = 0.000134) Since several thousand gene sets are examined by DAVID, need to account for multiple hypothesis testing (DAVID provides a Benjamini-Hochberg FDR adjusted p-value)
DAVID: Database for Annotation, Visualization and Integrated Discovery http://david.abcc.ncifcrf.gov/ click here to start a DAVID category enrichment analysis of a user supplied gene list
Paste list of genes (copy column from spreadsheet) - DAVID works best with array probe IDs rather than with gene symbols (but some annotation is in terms of the submitted IDs) Select type of gene identifier, e.g., official gene symbol or Illumina ID or Affymetrix ID etc. For standard organisms, using gene symbols rather than platform IDs should be fine. Tell DAVID whether this is list of distinguished genes (genes of interest from your data) or background For data from a platform (microarray, RNA-seq) that covers the full genome of a “standard” organism (e.g., human, mouse), you do not need to provide the “background” (the genes that are represented in the full dataset from the platform) – DAVID will take care of this internally.
The technical advantage of using platform IDs is that DAVID will, internally, convert the submitted IDs to gene symbols (actually DAVID’s internal identifiers) that correspond to those used in DAVID’s gene sets, so information is not lost due to mismatched identifiers. Also, if there are duplicate or synonymous gene symbols in the submitted list, or multiple IDs referring to the same gene, DAVID will automatically remove such duplication. If you gave DAVID gene symbols rather than array Probe IDs then will usually see a box indicating multiple corresponding species, click on OK
Click on the organism of your study (usually at the top of this list (scroll up from the bottom of this window)), then on Select Species (the number to the right of the organism is the number of unique genes for that organism DAVID recognized from the submitted list) If the background is the full genome of the organism then skip the instructions in the next 2 slides
If the data is from a specialty platform so the “background” (all the genes represented on the platform) is NOT the full genome, then need to give DAVID the list of genes that constitute the background: note can use gene symbols for the list of the distinguished genes, but must give DAVID “more unique” IDs for the background list, e.g., EntrezGene IDs or Illumina ProbeIDs. To do this click on upload,
Then paste in the list of Background genes, tell DAVID what type of IDs these are, and click on the background button to tell DAVID this is the list of background genes, then click here to submit Note must give DAVID the list of Background genes AFTER have given DAVID the list of Distinguished genes
Then in the new window that appears, click on Functional Annotation Tool
This is the number of unique genes DAVID recognizes . from the submitted list. DAVID converts the submitted gene identifiers (gene symbols or probe IDs or etc.) into internal IDs (“DAVID IDs”) and will combine certain submitted identifiers into 1 DAVID ID for its internal counting and resulting statistics. Then click on Functional Annotation Clustering – does DAVID analysis and displays results
Sample DAVID output (which happens to not have very much category enrichment) DAVID Benjamini false discovery rate (FDR) column For DAVID results, I suggest want their Benjamini FDR value to be ≤ 0.01 before consider category as possibly significant
DAVID output with good Benjamini adjusted p-values If click on a gene set name, will get information on that set of genes (see the next 2 slides for examples)
Information from DAVID from clicking on the “Defense Response” gene set name (which is a Biological Process Gene Ontology gene set)
Example of a DAVID display from clicking on a gene set which is a KEGG_PATHWAY the red stars designate genes occurring in the list submitted to DAVID This is a list of all the genes in the pathway (genes listed in red are in the submitted list) One can get more information on each gene by clicking on its name, or all at once by going to the bottom of this list and clicking on the desired option.
DAVID output – getting information on the genes of the submitted list occurring within each DAVID gene set If click on one of these bars, will get information on the genes of the list submitted to DAVID that are in the corresponding DAVID gene set (see the next slide)
The 7 genes from the list submitted to DAVID that were in the DAVID gene set “blood” (see previous slide)
DAVID 2D View Clicking on one of these icons shows which individual genes from the submitted list are in which gene sets of the corresponding Annotation Cluster (a group of related DAVID gene sets). Note the DAVID gene sets can be highly overlapping. genes DAVID gene sets
Sample Gene List for DAVID Experiment: Wegener’s granulomatosis (WG) vs. normal controls (C); 41 patients, 23 controls Genelist(84 distinct genes): FC ≥ 1.5 (up in WG) p-value ≤ 0.01 FDR ≤ 0.1
DAVID Output from the WG dataset gene list right click here and save target as desired file name to get tab delimited text file with extensive additional information including the genes from the submitted list occurring in each gene set Note the very small Benjamini column values DAVID will output information on every one of its gene sets that contain 3 or more genes from the submitted list (even if the statistics for the gene set are totally insignificant)
Note that it is not unusual to have a fair number of gene sets significantly (i.e., small DAVID Benjamini values) upregulated in one group (e.g., “treated” or “disease”) but few gene sets significantly (small DAVID Benjamini values) upregulated in the other group (e.g., “control”). Also, I consider the DAVID Benjamini value as a means to filter for potentially “interesting” gene sets, not as a literal FDR estimate (requiring an actual false discovery rate to be below 0.01 would be extremely conservative (to say the least)). It remains up to the user to decide if gene sets uncovered by DAVID (or, e.g., GSEA) are of biologicalsignificance for the system being studied.
Several other DAVID references: Da W Huang, Brad T Sherman, Qina Tan, Jack R Collins, W Gregory Alvord, Jean Roayaei, Robert Stephens, Michael W Baseler, H Clifford Lane and Richard A Lempicki, The DAVID Gene Functional Classification Tool: a novel biological module-centric algorithm to functionally analyze large gene lists, Genome Biology 2007, 8:R183 doi:10.1186/gb-2007-8-9-r183 Published: 4 September 2007 Da Wei Huang, Brad T. Sherman, XinZheng, Jun Yang, TomozumiImamichi, Robert Stephens and Richard A. Lempicki, Extracting Biological Meaning from Large Gene Lists with DAVID, Current Protocols in Bioinformatics 13.11.1-13.11.13, September 2009, Published online September 2009 in Wiley Interscience (www.interscience.wiley.com). DOI:10.1002/0471250953.bi1311s27
Optimizing the gene symbols submitted to DAVID Potential loss of information: The gene symbols from the microarray annotation might not be completely consistent with the gene symbols used by DAVID (but by now should not be a major problem for “standard organisms” (in particular, human, mouse) If submit platform IDs (e.g., Illumina Probe_IDs, Affymetrix Probe Set IDs) then DAVID precisely matches up genes in the submitted list with DAVID’s gene sets (e.g., GO categories, KEGG pathways) However then some annotation in the output is in terms of these IDs rather than the more recognizable gene symbols Optimal solution: use DAVID’s conversion tool (see next slides) (if working - it was not for a while recently) to get from platform IDs to gene symbols corresponding to those in DAVID’s library of gene sets. One could also submit: platform IDs to examine statistics, and separately, gene symbols to view genes within each gene set (or prepare a script to convert platform IDs back to gene symbols within the DAVID output file).
Then select the appropriate species (sometimes there will be IDs not recognized by DAVID as being well established genes)
1. Place mouse cursor here 2. Get this selection list 3. Click here to access ID conversion menu
2. 1. Click here, then select gene symbols, then submit to conversion tool 3.
Get this display – download <right click here and save target as> to get list (tab delimited text file) of gene symbols, consistent with the IDs used by DAVID in its gene sets, to submit to DAVID
The downloaded file has this form (note DAVID sometimes gives several lines with synonym gene symbols from a single submitted ID). Submit all these gene symbols to DAVID (will get same statistical results as if submitted the probe IDs, but the DAVID output displays and output file will now use the more recognizable gene symbols) DAVID will recombine synonym gene symbols internally when doing its counts of how many genes from the submitted list are in each gene set
Click on Upload and then submit the column of converted gene symbols (or restart DAVID fresh and submit the column of converted gene symbols)
Submit the converted gene symbols which will then be compatible with DAVID’s database of gene sets
Will get the multiple species message from DAVID, select the appropriate species (usually appears at the top of the list) – DAVID should have the new list highlighted, then can submit to analysis as before Then in the DAVID window which appears after click on Functional Annotation Tool, click on Functional Annotation Clustering
How to Understand the DAVID tab delimited text output file the following 4 slides are screen captures of part of a DAVID output tab delimited text file to which I have added explanatory comments (the first 2 rows) and saved as an Excel file