Download
1 / 14
140 likes | 181 Views
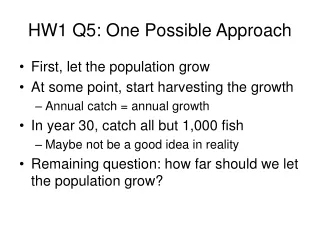
Explore a possible approach to managing population growth and harvesting in order to maintain a sustainable balance. Consider the implications of catching all but a certain number of fish after a certain time period.

E N D
HW1 Q5: One Possible Approach • First, let the population grow • At some point, start harvesting the growth • Annual catch = annual growth • In year 30, catch all but 1,000 fish • Maybe not be a good idea in reality • Remaining question: how far should we let the population grow?
MGTSC 352 Lecture 3: Forecasting “Simple” time series forecasting methodsIncluding SES = Simple Exponential Smoothing Performance measures “Tuning” a forecasting method to optimize a performance measure Components of a time series DES = Double Exponential Smoothing
Today’s active learning • Groups of two again • Recorder: person who got up earlier this morning
Ft+1 = LS Dt+ (1–LS) Ft t = 6:F7 = LS D6+ (1–LS) F6 t = 5: F6 = LS D5+ (1–LS) F5 t = 4:F5 = LS D4+ (1–LS) F4 t = 3:F4 = LS D3+ (1–LS) F3 t = 2:F3 = LS D2+ (1–LS) F2 t = 1:F2 = D1 Plug t = 5 equation into t = 6 equation: F7 = LS D6+ (1–LS) (LS D5+ (1–LS) F5) Active learning: Multiply out F7 = LS D6+ LS (1–LS) D5 + (1–LS)2 F5 Repeat for t = 4, 3, 2, 1 SES is really a WMA (pg. 19) Final result: F7 = [LS D6] + [LS (1–LS) D5] + [LS (1–LS)2 D4] + [LS (1–LS)3 D3] + LS (1–LS)4 D2] + (1–LS)5 D1
The Weights LS = 0.5 LS = 0.3 LS = 0.1
Weights get smaller and smaller for demand that is further and further in the past – except: • Oldest data point may have more weight than second oldest data point. • Only matters for small data sets and small LS
Simple Models Recap • LP, AVG, SMA, WMA, SES • Three phases: • Initialization • Learning • Prediction • Prediction: so far, we’ve only done one-period-into-the-future • k periods-into-the-future: Ft+k = Ft+1, k = 2, 3, … • Active learning: translate formula into English
Performance Measures • BIAS = Bias • MAD = Mean Absolute Deviation • SE = Standard Error • MSE = Mean Squared Error • MAPE = Mean Absolute Percent Error (formulas in course pack, p. 21) Excel
Pg. 23 Components of a Time Series • level • trend • seasonality • cyclic (we will ignore this) • random (unpredictable by definition) • (Simple) Exponential Smoothing incorporates... • Level only • Will lag trend • Miss seasonality
Level, Trend, Seasonality Level + random Level + trend + random Level + trend + seasonality + random
Level, Trend, Seasonality • Additive trend, multiplicative seasonality • (Level + Trend) seasonality index • Example: • Level: 1000 • Trend: 10 • Seasonality index: 1.1 • Forecast: (1000 + 10) 1.1 = 1111
Models • Double Exponential Smoothing • Level, Trend • Today • Triple Exponential Smoothing • Next week • Simple Linear Regression with Seas. Indices • Next week
Pg. 25 Double Exponential Smoothing • Initialization • Level, Trend • Learning • Prediction • Formulas in course pack • Work on an example Excel
Learning In general: UPDATED =S NEW + (1 – S) OLD