Download
1 / 9
90 likes | 97 Views
Learn how to generate random numbers in Excel and plot histograms to visualize their distributions. Includes uniform and normal distributions.

E N D
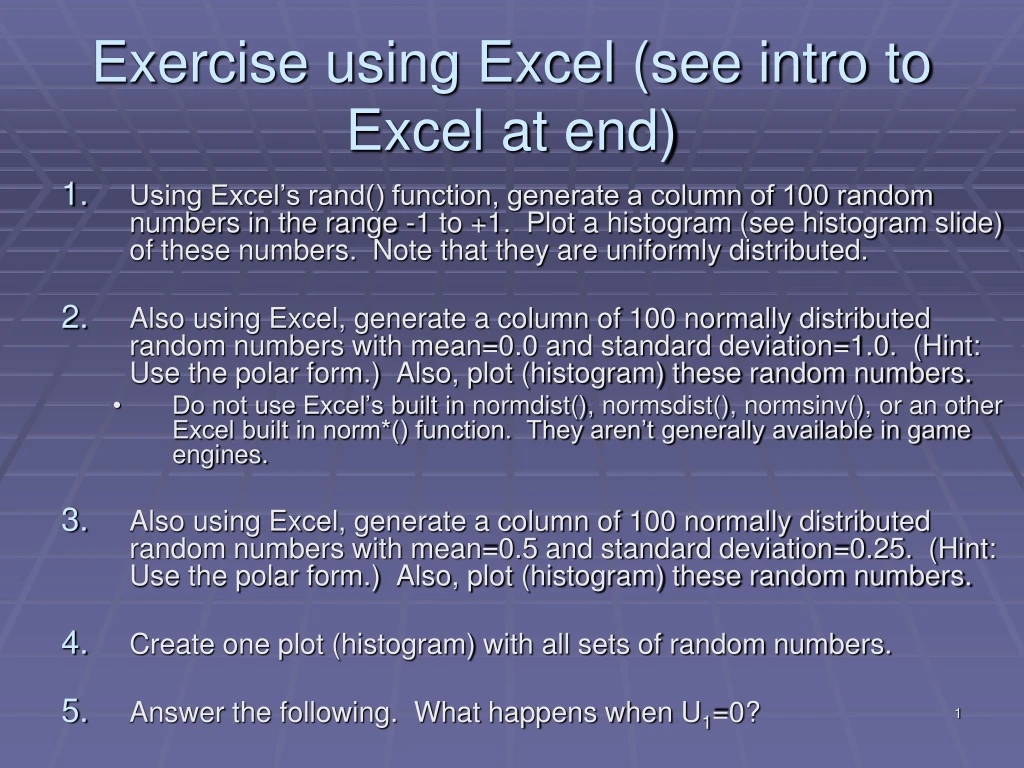
Exercise using Excel (see intro to Excel at end) • Using Excel’s rand() function, generate a column of 100 random numbers in the range -1 to +1. Plot a histogram (see histogram slide) of these numbers. Note that they are uniformly distributed. • Also using Excel, generate a column of 100 normally distributed random numbers with mean=0.0 and standard deviation=1.0. (Hint: Use the polar form.) Also, plot (histogram) these random numbers. • Do not use Excel’s built in normdist(), normsdist(), normsinv(), or an other Excel built in norm*() function. They aren’t generally available in game engines. • Also using Excel, generate a column of 100 normally distributed random numbers with mean=0.5 and standard deviation=0.25. (Hint: Use the polar form.) Also, plot (histogram) these random numbers. • Create one plot (histogram) with all sets of random numbers. • Answer the following. What happens when U1=0?
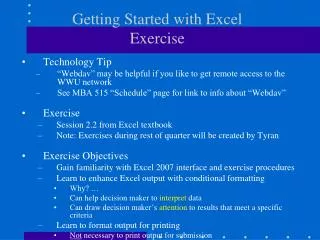
Creating and plotting a histogram using Excel Steps: 1. Create column of data. 2. Create column of bins (categories). 3. Select “array” of columns for histogram. 4. Type in =frequency( a2:a1001, e2:e23 ) and then type ctrl+shift+Enter.
Exercise using Unity and C# Create a new class called MyRandomGenerator, and implement the following: 6. Write a function called uniform that, given a min and max, generates a random number in the interval [min,max]. 7. Write a function called normalPolar that, given a mean and standard deviation, generates a random number sampled from that distribution. 8. Write a function called normalCartesian that, given a mean and standard deviation, generates a random number sampled from that distribution. 9. Using some built in function to get the time, determine how much time is required to generate 1000 random numbers via each of the above methods. (If 1000 random numbers can be generated in < 5 seconds, use a number larger than 1000.)
Exercise using Java, C/C++, or C# 10. Real numbers (float and double) and integers (int, short, char, byte (in Java)) are represented using a finite number of bits. Therefore, we can only have a finite number of real numbers or integers. What is the smallest non-zero number that can be represented by a double? (Hint: Consult java.lang.Double or limits.h.) 11. Given the above, is there a maximal value for Z0 in the equation below? 12. Is the range of possible values sampled from a uniform distribution bounded or unbounded? Is the range of possible values sampled from a normal distribution bounded or unbounded? Is the range of values generated by an implementation of the polar form of the Box-Muller algorithm bounded or unbounded?
Values and calculations Constants in col A; expressions in col B (calling built in functions and referring to values in other cells..
Copy exp in B1, select multiple cells, and paste. Note cell changes automatically.
Use : to refer to multiple cells. For example, =sum(a1:a4) calculates the sum of the values in cells a1 through a4. Avoid automatic cell changes by using $.